


The Upper Hudson is the part of the valley closest to the Berkshires and the Connecticut border, where Columbia County’s rolling countryside transitions into open farmland and forested ridges, and Greene County’s western edge climbs into the Catskill highlands. The buyers here are not primarily commuters. They are people seeking distance: from density, from noise, from the rhythm of the city. The result is a market built around large lots, historic structures, and properties that arrive with stories already attached. Farms that may have changed hands twice in 200 years. Colonials and federal-style houses that predate the nation. Estates whose acreage is measured in hundreds rather than fractions. The luxury market here is quiet by design, and the pace of transactions reflects that.
The Upper Hudson area, anchored by the Albany metropolitan area and extending into the rural and resort landscapes to the south, comprises Albany, Columbia, Greene, and Rensselaer counties. The 4 counties span a wide spectrum in terms of price and luxury depth. On the more accessible end, Albany carries a median listing price of $363,450, and Rensselaer follows closely at $350,687, with luxury entry points (90th percentile) well below the national threshold of $1,274,423 in both counties. Columbia and Greene counties tell a different story.
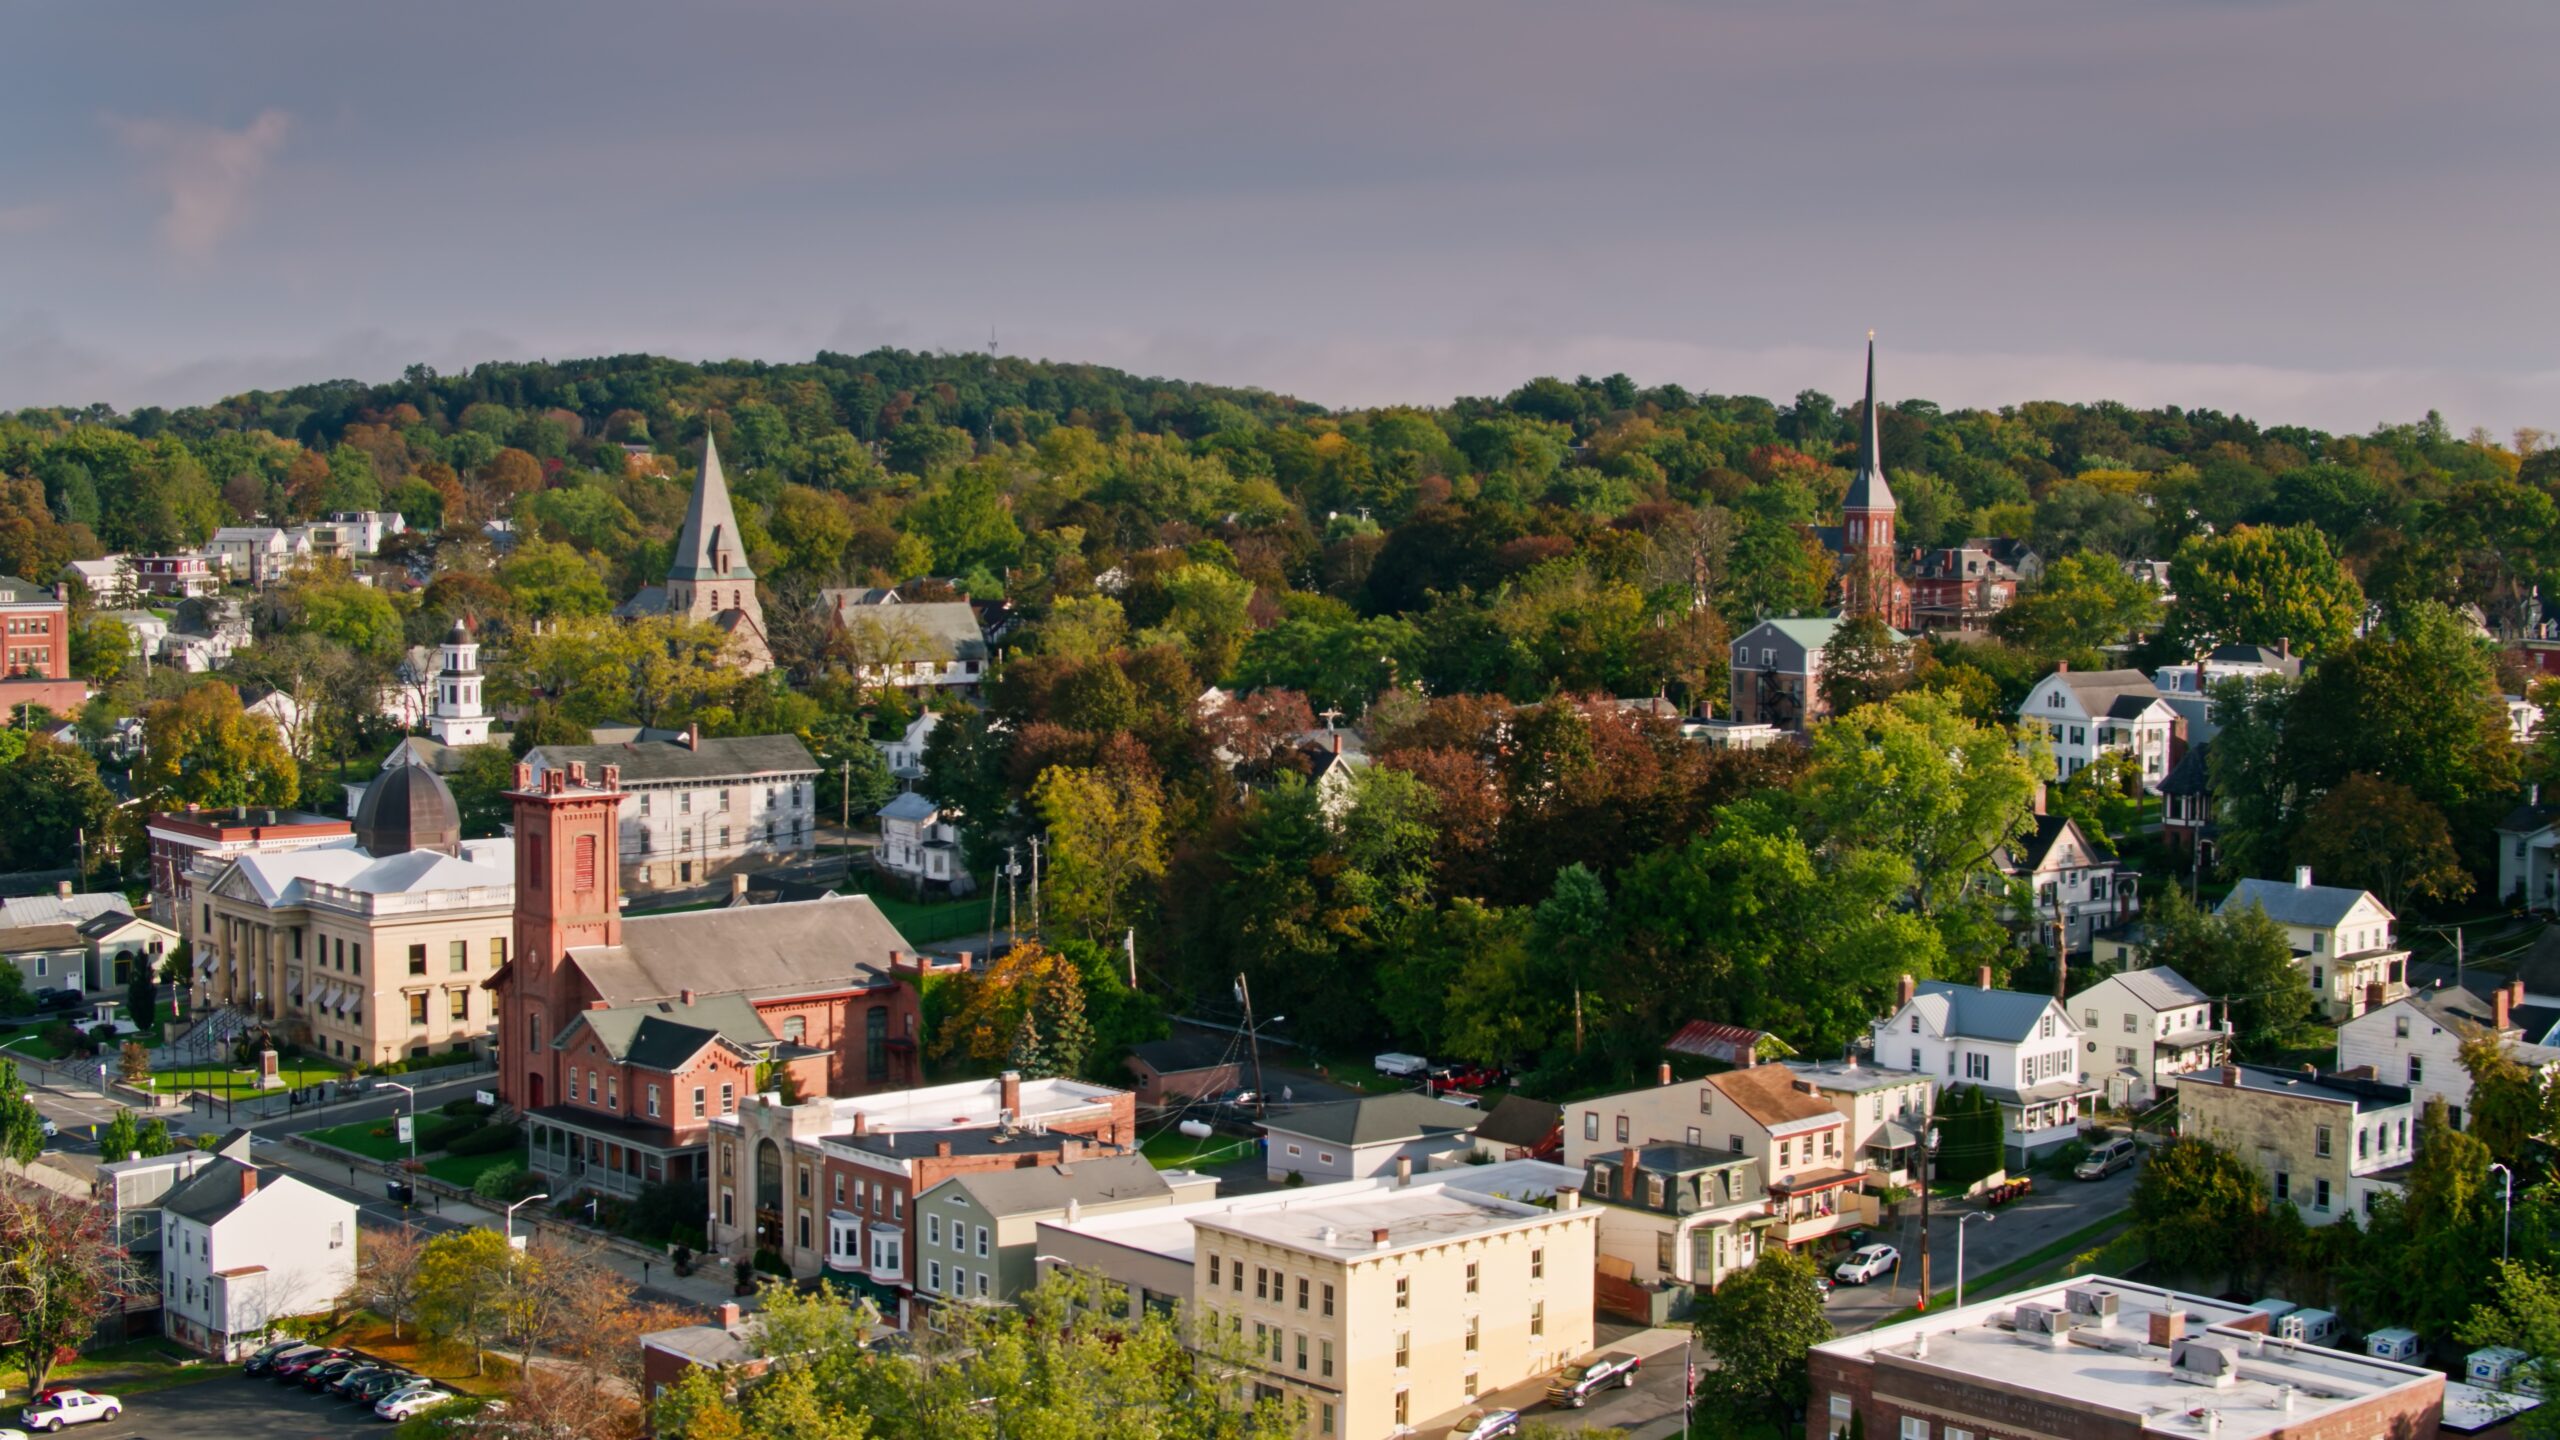
Aerial Catskill, NY Getty Images
Columbia County has the largest share of million-dollar properties in the Upper Hudson at roughly 28.5%, outpacing the next-closest county, Greene, by more than 10 percentage points. The luxury entry point in Columbia County reached $2,651,250 in April 2026, up 8.2% from a year ago. That figure is more than twice the national luxury benchmark of $1,274,423, a gap that has widened considerably since 2019. When measured from April 2019 to April 2026, Columbia’s 90th-percentile threshold grew by approximately 97%, nearly 2.5 times the national rate of 38% over the same period. That upward movement in the top 10% is notable in the context of a county where the overall median listing price edged down slightly year over year, suggesting appreciation is more concentrated at the top than spread evenly across the market.
The housing stock itself tells the story as clearly as the price data. Columbia County’s most common era of construction is pre-1900, with 24% of its active listings falling into that category, 24 times the national rate of 1%. Combined with another 19% of listings built between 1900 and 1950, roughly 43% of Columbia’s available housing stock predates the mid-20th century. Rensselaer County follows a similar arc, with 18% pre-1900 stock and 44% built before 1950. For buyers, this means the overwhelming majority of what comes to market in these counties is architectural history, not a product. Properties here carry original wide-plank floors, hand-hewn beams, stone foundations, and built dates that predate most American cities.
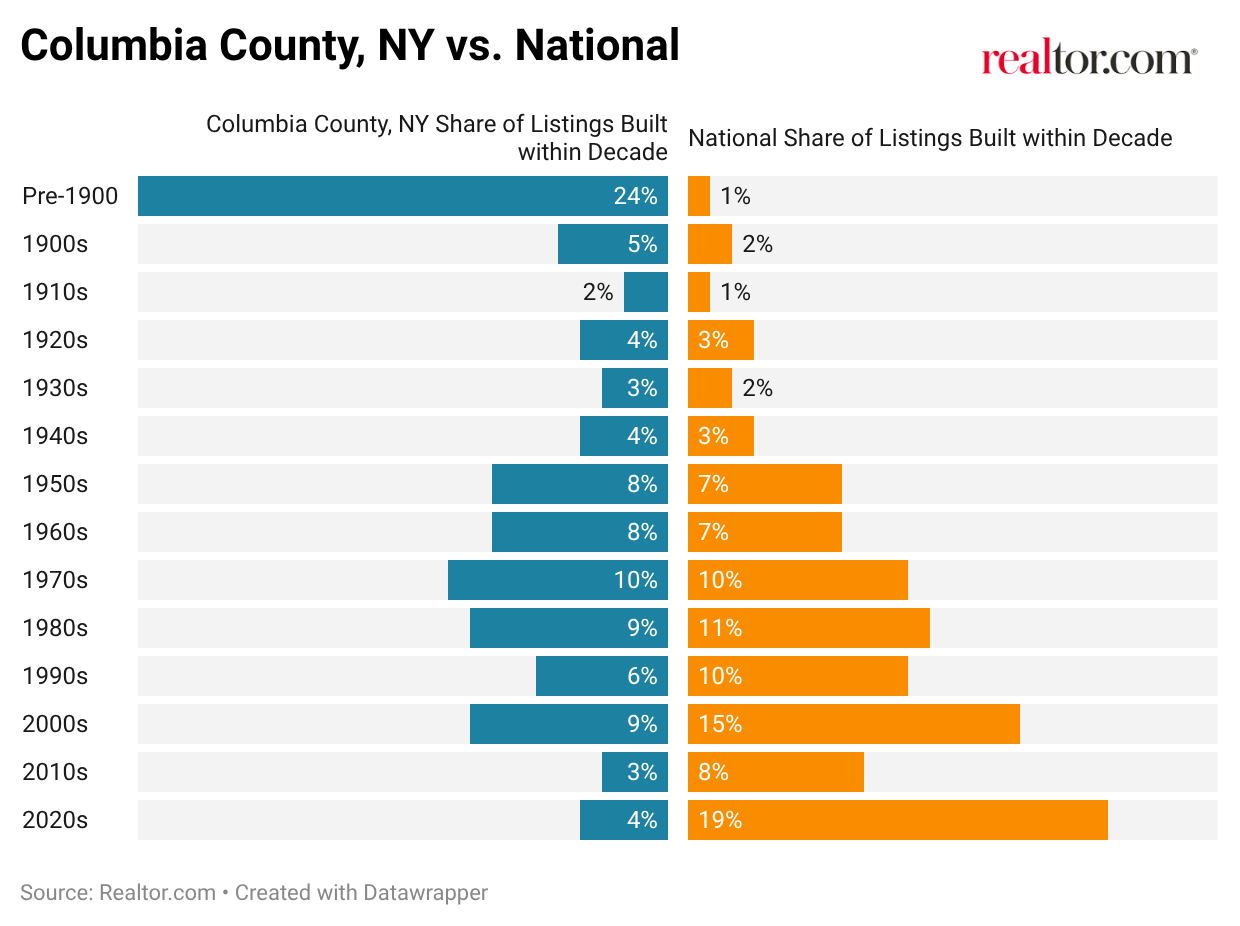
Across both counties, homes built in the 2020s account for 4% to 6% of active listings, compared with 19% nationally, confirming that the available pool is shaped more by what already exists than by what is being added.

All three Mid-Hudson counties entered 2022 at elevated million-dollar counts, then pulled back sharply as mortgage rates climbed. Orange County hit a trough of 39 properties in early 2022, Ulster fell to 43, and Dutchess compressed to 60. What followed tells the story of the current
Greene County, positioned along the western bank of the Hudson with direct access to the Catskill Mountains, has the strongest luxury growth trajectory in the Upper Hudson. Its 90th-percentile threshold grew roughly 114% from April 2019 to April 2026, three times the national rate, carrying the county from well below the national luxury benchmark in 2019 to comfortably above it today, with its current entry point of $1,496,500 exceeding the national luxury floor. That appreciation is visible in the count data as well: million-dollar properties climbed from 27 in June 2016 to a peak of 87 in August 2025, before settling to 68 in April 2026, a gain of roughly 152% over that span. At 129 days on market, the luxury tier here attracts a patient, deliberate buyer pool. Greene County’s rise reflects two primary forces: second-home demand from New York City and a general increase in mountain towns post-pandemic. These factors have lifted prices across various markets.
Columbia County’s trajectory reflects a different dynamic. The county entered the period as the Upper Hudson’s most established luxury market, with 103 million-dollar properties in June 2016 and a count that climbed to a high of 120 by late 2018. What followed was a prolonged contraction, bottoming at 33 properties in April 2022 as the rate environment shifted and discretionary luxury buyers stepped back. Since then, the county has recovered steadily to its current level of 70. The arc illustrates what a maturing, low-inventory market looks like when financing conditions tighten: recoveries here are gradual, driven by owner conviction rather than developer timelines.
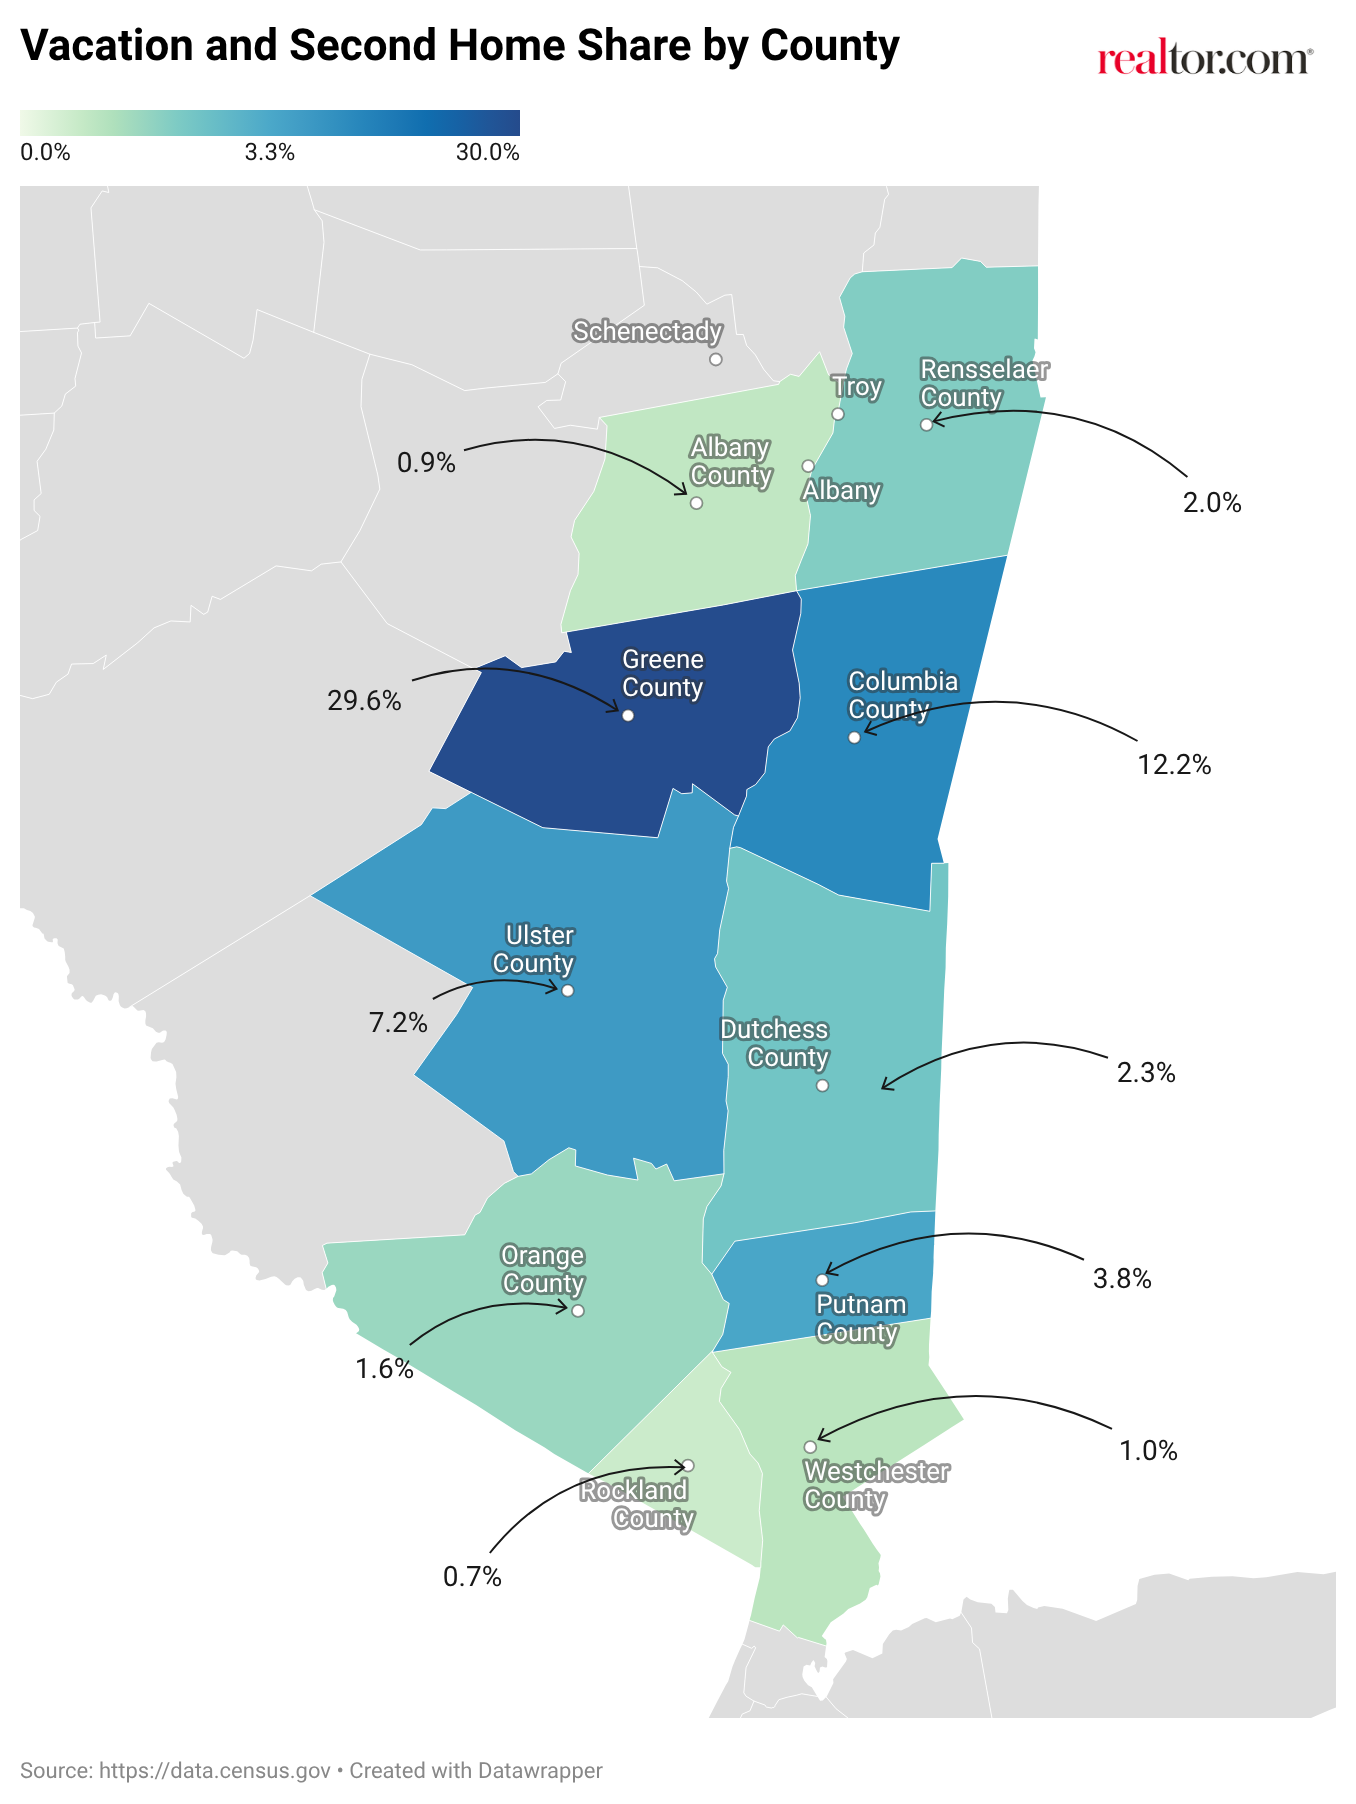
Greene County stands apart from the rest of the region on one key measure: nearly 3 in 10 housing units are classified as seasonal or vacation properties, roughly 9 times the national share of 3.3%. The map below shows how that second-home concentration diminishes as you move south toward the New York City suburbs, where primary residence is much more common.
Albany and Rensselaer counties have seen million-dollar counts decline from their 2016 levels, reflecting both price structures and the limited depth of their luxury tiers. Albany’s 90th-percentile growth of 38% from April 2019 to April 2026 matched the national rate almost exactly, meaning it has kept pace but not gained ground relative to the broader luxury market. Rensselaer at 84% growth outpaced the national benchmark by more than double, though its luxury entry point of $775,430 still sits below the national luxury floor.
Standout ZIP Codes – Upper Hudson
| ZIP | Area | County | Median Listing Price | Million-Dollar Share | Median Days on Market | Median Square Feet |
| 12136 | Old Chatham | Columbia | $2,895,000 | 57.10% | 74 | 5,188 |
| 12017 | Austerlitz | Columbia | $1,880,000 | 71.40% | 68 | 1,951 |
| 12529 | Hillsdale | Columbia | $950,500 | 42.10% | 100 | 2,129 |
| 12534 | Hudson | Columbia | $722,500 | 24.10% | 70 | 2,218 |
| 12106 | Kinderhook | Columbia | $697,500 | 20.00% | 53 | 2,941 |
| 12496 | Windham | Greene | $579,000 | 30.00% | 130 | 2,076 |
| 12485 | Tannersville | Greene | $630,000 | 26.70% | 144 | 2,371 |
| 12442 | Hunter | Greene | $385,000 | 17.60% | 138 | 1,288 |
Old Chatham (12136) leads the Upper Hudson by median listing price at $2,895,000, with a 57.1% million-dollar share. Properties here represent the archetype of Columbia County luxury: large lots, often measuring in the hundreds of acres, with built dates that can stretch back to the colonial era. A median square footage of 5,188 reflects homes at a scale rarely seen elsewhere in the valley, and the 74-day days on market is consistent with a deliberate buyer profile accustomed to the time that transactions at this level require.
Austerlitz (12017) carries the highest million-dollar share of any ZIP in the Upper Hudson at 71.4%, with a median of $1,880,000, meaning nearly 3 in 4 active listings here are priced above $1 million. The rural interior of southern Columbia County draws buyers seeking significant privacy and acreage, with an overwhelmingly existing historic product mix. New construction plays no meaningful role in this market.
Hillsdale (12529), near the Massachusetts and Connecticut borders, and Hudson (12534), the county’s most active urban market, represent the range within Columbia County’s luxury tier. Hillsdale’s 42.1% million-dollar share and 100-day days on market reflect an unhurried estate market; Hudson’s 70-day pace and 24.1% million-dollar share across 54 total listings reflect a year-round community that has attracted a growing buyer base drawn to its gallery district, restored architecture, and walkable downtown.
Kinderhook (12106), best known as the birthplace of President Martin Van Buren, is among the more quietly compelling data points in the Upper Hudson. Its 80.3% year-over-year median growth to $697,500 is the strongest in Columbia County this period, driven by a combination of its historic village character, proximity to Hudson and the Taconic State Parkway, and a gradual recognition among buyers that its federal-period buildings and village green represent something that cannot be manufactured elsewhere.
In Greene County, Windham (12496) is where the luxury depth is most visible. 21 of 70 active listings are priced above $1 million, a 30% million-dollar share. Days on market of 130 are elevated, consistent with a resort market where buyers are selective, and sellers are patient. Tannersville (12485) and Hunter (12442) anchor the mountain end of Greene County’s luxury story, with Hunter in particular illustrating the prestige-versus-count dynamic: a median of just $385,000 but 16 active million-dollar listings and a 90th percentile of $1,500,000. The low overall median reflects Hunter’s broad range of property types, from modest ski-season units to significant mountain estates, with the upper tier pulling well away from the middle.
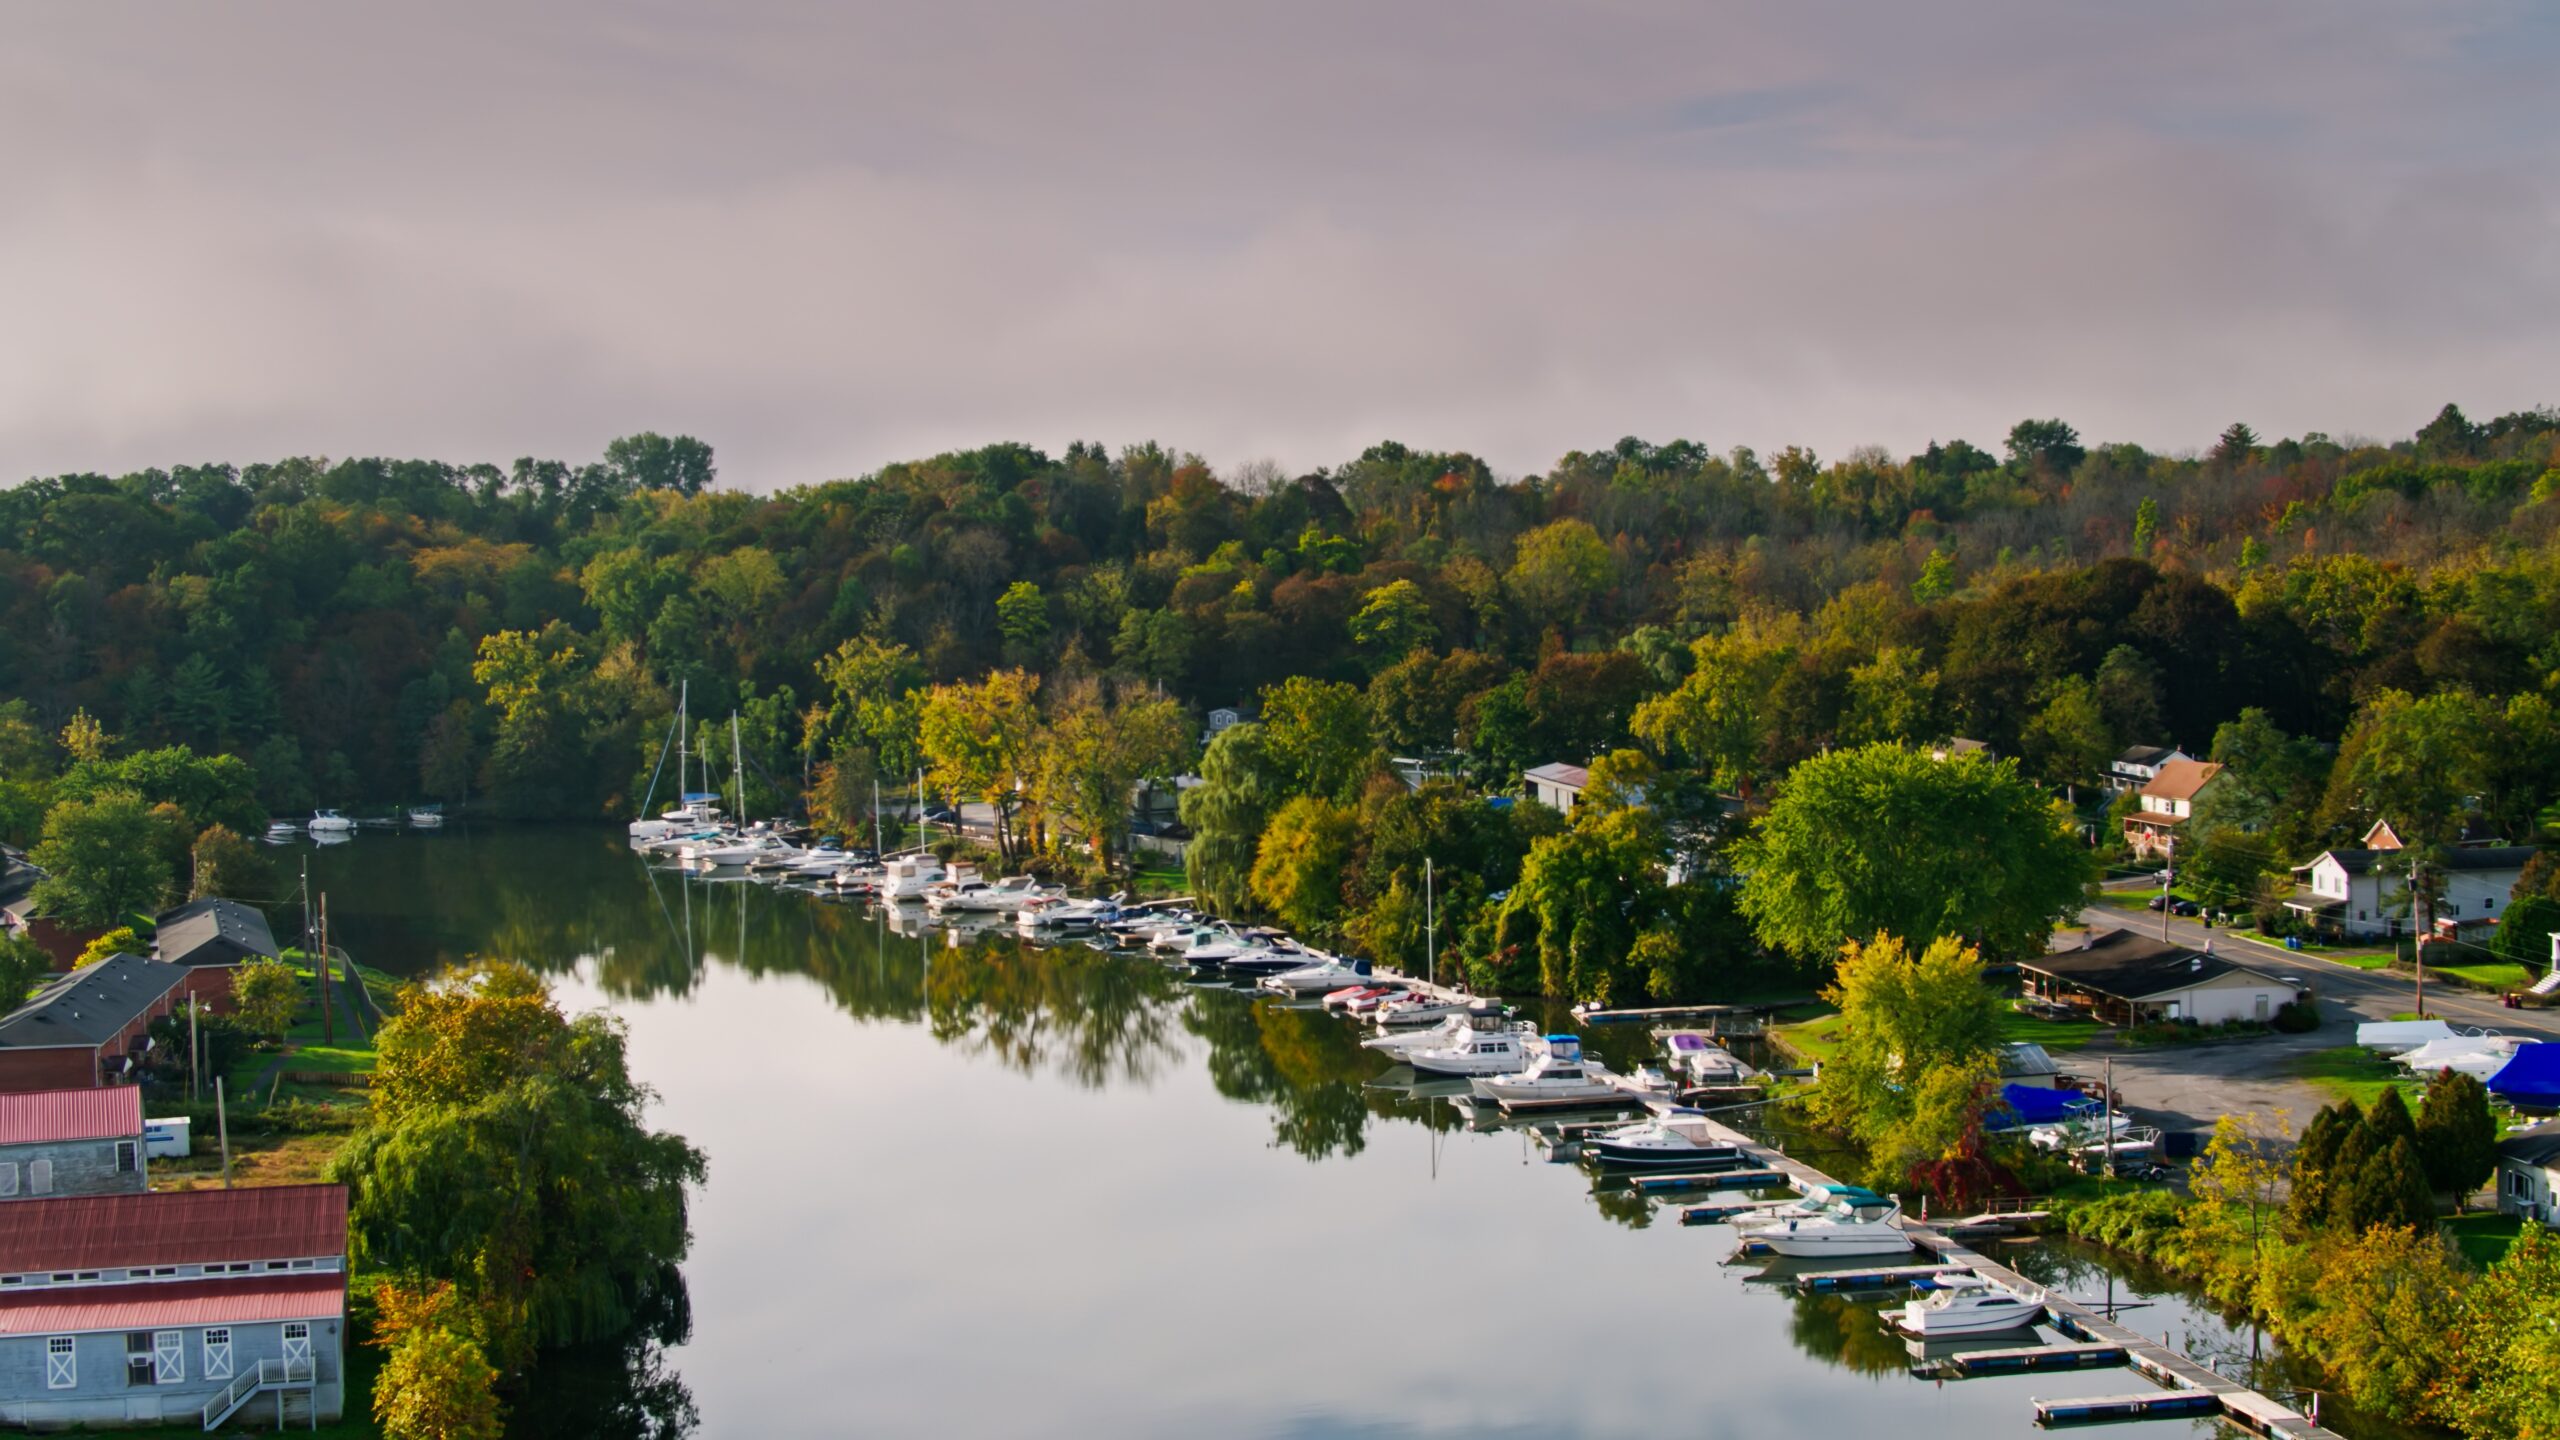
Aerial Catskill Yacht Club Getty Images
The Hudson Valley does not have a single luxury market. It has at least ten, layered across the valley’s distinct regions and united by a shared river, a shared history, and a shared appeal to buyers seeking an alternative to the density and cost of the New York City metro.
The defining data point across the full region is how consistently the Hudson Valley has outpaced the national luxury benchmark since 2019. The national 90th percentile grew by 38% from April 2019 to April 2026. Eight of the valley’s ten counties exceeded that rate: Ulster (+121%), Dutchess (+110%), Greene (+114%), Columbia (+97%), Rensselaer (+84%), Rockland (+89%), Orange (+85%), and Putnam (+41%). Albany matched the national rate almost exactly. Only Westchester fell short, at +22%, reflecting a market already well above the national level in 2019, so the proportional growth runway was smaller.
At the northern end, Columbia County’s estate-driven ZIPs like Old Chatham and Austerlitz draw buyers whose priorities are acreage, historic character, and deliberate distance from the city. In the Mid-Hudson, the contrast between Millbrook’s legacy equestrian estates and Woodstock’s newly minted million-dollar median captures the breadth of what the valley offers at the luxury tier. Tuxedo Park in Orange County stands apart from both, with a history that predates the luxury market concept itself and a top-of-the-market position that has no parallel elsewhere in the Mid-Hudson. At the southern end, Westchester’s 43-day days on market at the luxury entry tier, down 41.6% year over year, reflects a market operating at a fundamentally different tempo from the rest of the valley.
The stock of homes being transacted here also matters. Across all three regions, new construction plays a limited role in the luxury segment. The market is overwhelmingly composed of existing homes, some of them centuries old. That supply cannot be replicated, and for buyers drawn specifically to the Hudson Valley, that is the point. When a property in Stone Ridge or Austerlitz or along the Westchester waterfront reaches the market, it often does so just once in a generation. The buyers who understand that dynamic are the ones the data consistently shows moving quickly when the right home appears.
Methodology
All data in this report is sourced from Realtor.com® listing trends as of April 2026, reflecting active inventory of existing homes, including single-family residences, condos, townhomes, row homes, and co-ops. Listings reflect only those provided by MLS platforms to Realtor.com through a listing feed. New-construction listings are excluded unless actively listed on participating MLSs.
Luxury segmentation is based on market-specific price percentiles, with the 90th percentile representing entry-level luxury, the 95th percentile marking high-end luxury, and the 99th percentile indicating ultraluxury. All calculations are based on listing prices, not final sales prices.
Metropolitan and micropolitan areas are defined using the Office of Management and Budget’s OMB-2023 delineations, with Claritas 2025 household estimates used for relative comparisons. Where appropriate, we limited analysis to metros or micros with a minimum threshold of active million-dollar listings on average over the past year to ensure meaningful comparisons.
Historical listing trend data extends to July 2016, but year-over-year comparisons in this report use March 2025 as the baseline.
Luxury by the Numbers
90th percentile = Entry-level luxury (top 10% of prices)
95th percentile = High-end luxury
99th percentile = Ultraluxury (often rare or custom properties)


