


Market outlook
August is always a time when housing activity begins to slow, and the market this year got no help from the outside world. Mortgage rates hit their 2026 high on August 6 and never really came back down, hovering near that level for the rest of the month. Between the oppressive summer heat and rates exceeding their year-ago levels for the first time since October 2025, it was hardly an environment inviting buyers and sellers off the sidelines en masse.
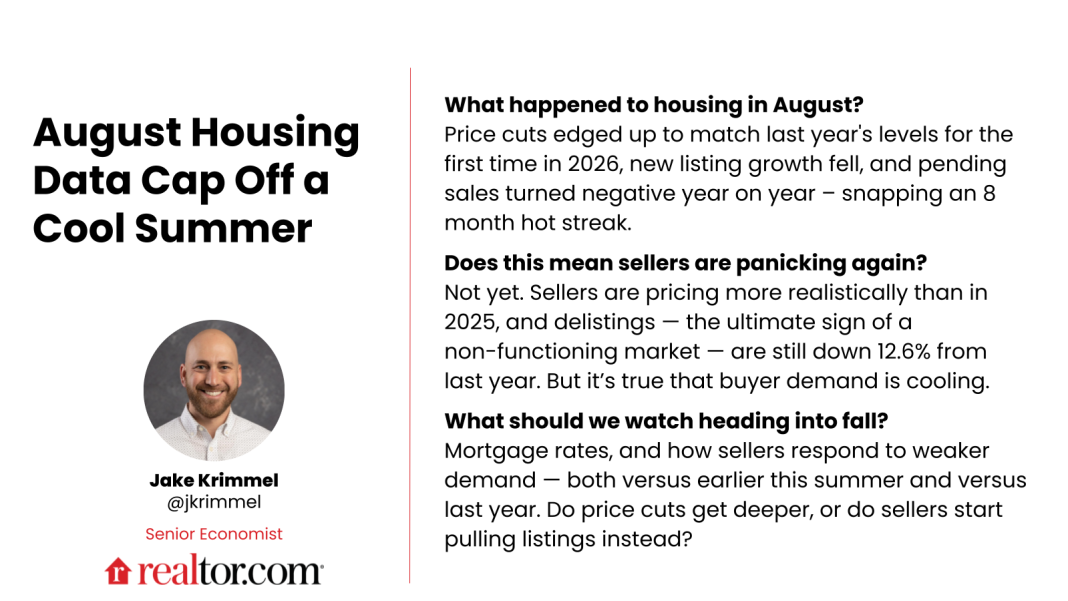
The August Realtor.com® data bear that out: new and pending listings both fell year over year; meanwhile, price cuts edged up and now match last year’s levels. With mortgage rate and inflation headwinds showing little sign of letting up, this deceleration could continue in the coming months. And thanks to last fall’s surge in activity, the year-over-year comparisons ahead only get tougher – important context to keep in mind when next month’s numbers come in.
In This Report
August’s top storylines, according to the data
From Cruel Summer to Cool Summer
Median list prices fell for a 10th straight month, but the decline (-1.3% year over year) has roughly halved from July’s pace. Luckily, sellers are not revolting like they did in 2025 with this year’s delistings down nearly 13% versus last August.
Price cuts finally match last year’s pace
20.4% of listings saw a price cut in August, equalling last year’s level for the first time in 2026, after trailing it by up to two points all spring. The rise was notable in the Midwest, with all 10 metros seeing more cuts than in July.
Pending Sales Snap Their Hot Streak
After eight straight months of year-over-year growth (peaking at +4.8% in May), pending sales (listings under contract) turned negative (-0.2% YoY) in August for the first time since last November.
Key questions
Q: Last month, we said the housing market was on “resilience watch for the foreseeable future.” Did that resilience finally break in August?
A: It’s hard to say how much of August’s slowdown is seasonal versus real headwinds finally catching up. It’s a time of year when activity typically winds down rather than ramps up, and mortgage rates climbing over 20 basis points since July 1 only compounds that. Plus, the US just suffered through two of the hottest months on record– hardly ideal house-hunting weather. So there were already seasonal housing market headwinds, and the rate backdrop isn’t helping matters. Monthly mortgage rates have now risen for six straight months, from a 2026 low of 6.05% on average in February to 6.67% in August. The year-over-year rate advantage has disappeared: as recently as June, rates were running more than 30 basis points below year-ago levels; by August, they were running roughly 10 basis points above. That shift should color how we read this month’s year-over-year numbers. Regardless of whether it’s due to dog-days of summer seasonality or real signal, housing activity is slowing for now.
Q: In July we said to watch price cuts, pending sales, and delistings in tandem. What’s the update there?
A: Good news and bad news. Those three were the hallmarks of last year’s Cruel Summer, and the good news is sellers’ pricing realism has helped the market sidestep a repeat of 2025, when the market stalled with buyers and sellers too far apart and unwilling or unable to budge. The bad news: price cuts and pending sales are now moving in the wrong direction. The national August price cut rate is now running slightly above last year’s level for the first time in 2026, and pending sales just went negative year over year for the first time in eight months. Both are signs of weakened buyer demand in the face of higher mortgage rates at the wrong time of the year. Fortunately, summer delistings, the ultimate sign of a non-functioning market, are 12.6% below last year’s pace, with no July or August spike this time; the quit rate (delistings as a share of active inventory) has held flat around 5.5% for six weeks.
Q: What should we be monitoring heading into September?
A: Three things again. First, whether the delistings gap versus 2025 holds or if a September spike shows up, and whether it’s concentrated in certain metros. Second, price-cut behavior and strategy. So far this year, sellers have cut less often and less deeply, with repeat cuts (3+ reductions) nearly halved from last July and overall discounts at their smallest since 2022. Sellers may start to get more desperate in September and subsequent months when mortgage rates are likely to remain higher than they were at this time in 2025. Third, geography – particularly growing softness in the Midwest and Northeast where inventory and price cuts are on the rise.
Back to top
Core metrics: August 2026
Median list price: $424,500
- vs. previous month: Down 1.0%
- vs. previous year: Down 1.3%. This marks the 10th straight month of falling year-over-year list prices, but that difference has been narrowing and is roughly half of July’s 2.4% decline.
Prices per square foot: -1.8% year over year, falling faster than the headline price.
At the regional level: Year-over-year median list prices fell in three of the four regions (-3.6% in the Northeast, -2.6% in the South, -2.1% in the West). Prices were flat in the Midwest (0.0%). Adjusting for home size, median list price per square foot still rose in the Midwest (+1.8%), while the Northeast turned negative (-0.9%) alongside the South (-2.9%) and West (-1.0%).
At the metro level: Median list price per square foot is falling in 36 of the top 50 metros, up from 34 last month. The largest per-square-foot declines were in Austin (-8.1%), Tampa (-5.6%), and Memphis (-4.1%); the largest gains were Providence (+9.3%), Indianapolis (+4.4%), and Chicago (+3.6%).
Active listings: 1,140,000
- vs. previous month: +1.2%
- vs. previous year: +3.6%, a slight acceleration from July’s +2.1% and the fastest year-over-year growth so far this year.
- vs. pre-pandemic: Nationwide inventory is 11.1% below typical pre-pandemic levels, roughly unchanged from July’s gap.

Importantly, this has more to do with inventory growth decelerating last August, thanks in large part to last year’s delisting wave, than any true signal in this August’s data.
At the regional level: Inventory rose across all four regions for the first time in several months. The Midwest (+10.5% YoY) extended its lead over the Northeast (+9.1%) as the fastest-growing region; the West (+3.2%) and South (+1.1%) both firmed up from roughly flat readings in July.
At the metro level: 37 of the 50 largest markets recorded year-over-year inventory growth, up from 34 in July. The sharpest increases were in Minneapolis (+32.9%), Buffalo (+29.8%), and Seattle (+27.3%); the steepest declines were Jacksonville (-16.9%), Miami (-15.0%), and San Francisco (-13.0%).
New listings: 401,760
- vs. previous month: -5.2%, a typical seasonal pullback heading into late summer
- vs. previous year: -0.1% – flat to down, similar to July’s unchanged reading

At the regional and metro levels: New listings rose year over year in the West (+1.5%), but fell in each of the other regions: -0.5% in the Northeast and Midwest, and -0.9% in the South. Growth was strongest in San Jose (+16.6% YoY), Minneapolis (+13.3%), and Virginia Beach (+12.9%), and weakest in Oklahoma City (-10.1%), Chicago (-7.5%), and Memphis (-5.4%).
A Note on Spring/Summer Delisting Trends:
Delisting levels remain below last year’s highs, and have not exhibited the sort of late-summer spike we saw in 2025. Delistings are down 12.6% year over year in August, after running, respectively, 8.3% and 4.7% below 2025 levels in June and July. The quit-rate (delistings as a share of active inventory) has been flat over the past 6 weeks around 5.5%.
Time on the market: 60 Days
- vs. previous month: +3 days, typical seasonal drift into late summer (July’s MoM move was +4 days)
- vs. previous year: unchanged. A second straight month of homes sitting for the same length of time or less than a year ago, following July’s first outright YoY decline in more than two years.

Regional and metro levels: Time on market year on year was flat in the Northeast and West, ticked up (+1 day) in the Midwest, and fell one day in the South. Days on market rose in 25 of the top 50 metros, down from 29 in July. The largest increases were in Boston (+6 days), Baltimore (+5), and Cincinnati (+5). The largest declines were Jacksonville (-9 days), San Francisco (-7), and Miami (-5).
Pending Sales and Contract Activity
Stock of Listings in Pending Status:
- vs. previous year: -0.2%. This snaps an 8-month streak of year-over-year pending-sales growth. Pending listings growth has been decelerating since May.
- vs. previous month: -4.6%, consistent with the normal seasonal cooling into late summer.
Flow of New Contract Signings:
Contract signings fell 3.4% year over year.
Price cuts: 20.4% of listings saw a price cut in August
- vs. previous month: +0.4 percentage points
- vs. previous year: +0.0 percentage points. For the first time this year, the national cut rate has matched last year’s level, completing the convergence flagged in the June and July reports (July was still 0.5–0.6pp below its year-ago rate).

At the regional level: Price cuts remain least common in the Northeast (14.1% of listings saw a price cut in August) and Midwest (19.6%), and most common in the West (22.0%) and South (21.4%). The Northeast (+1.2pp) and Midwest (+0.8pp) continue to run above their year-ago cut rates, as they did in July, while the South (-0.4pp) and West (-0.3pp) have both nearly closed their remaining gap below last year, a much narrower spread than July’s -0.8 to -1.6pp readings.
At the metro level: August price cuts were least common in Hartford (10.1%), New York (10.2%), and Buffalo (11.1%), and most common in Denver (31.4%), Portland (30.5%), and Salt Lake City (30.3%). Thirteen of the top 50 metros see a quarter or more of listings with a cut (up by one from July), and 27 of 50 metros are now running above their year-ago cut rate, up from a minority in July. The convergence story is broadening past just the Northeast and Midwest.
Back to top
Summary tables
National
| Metric | August 2026 | Change Over July 2026 (MoM) | Change Over August 2025 (YoY) | Change Over August 2019 | Change Over August 2022 |
| Median listing price | $424,500 | -1.0% | -1.3% | 34.4% | -1.9% |
| Active listings | 1,140,035 | 1.2% | 3.6% | -7.7% | 56.9% |
| New listings | 401,760 | -5.2% | -0.1% | -16.2% | -4.0% |
| Median days on market | 60 | 3 | 0 | 1 | 19 |
| Price reductions | 20.4% | 0.4 | 0.0 | 2.8 | 1.1 |
| Median List Price Per Sq.Ft. | $224 | -1.1% | -1.8% | 48.5% | 0.8% |
Regional Listings
| Active Listings | New Listings | ||||||
| Aug. 2026 | YoY | vs. Pre-Pandemic | Aug. 2026 | YoY | vs. Pre-Pandemic | ||
| USA Avg. | 1,140,035 | 3.6% | -11.1% | 401,760 | -0.1% | -18.1% | |
| Northeast | 118,772 | 9.1% | -46.5% | 52,612 | -0.5% | -17.0% | |
| Midwest | 176,598 | 10.5% | -33.0% | 84,944 | -0.5% | -12.9% | |
| South | 595,496 | 1.1% | 4.7% | 177,676 | -0.9% | -1.3% | |
| West | 246,134 | 3.2% | 10.0% | 85,128 | 1.5% | -18.7% | |
Regional Prices
| Median List Price | Median List Price per Sq. Ft. | ||||||
| Aug. 2026 | YoY | vs. Pre-Pandemic | Aug. 2026 | YoY | vs. Pre-Pandemic | ||
| USA Avg. | $424,500 | -1.3% | 34.4% | $224 | -1.8% | 48.5% | |
| Northeast | $516,000 | -3.6% | 41.8% | $295 | -0.9% | 64.1% | |
| Midwest | $325,000 | 0.0% | 36.6% | $182 | 1.8% | 50.4% | |
| South | $380,000 | -2.6% | 28.8% | $202 | -2.9% | 45.4% | |
| West | $599,000 | -2.1% | 30.0% | $319 | -1.0% | 44.6% | |
Regional Market Pressure
| Median Time on Market | Share of Listings With Price Cuts | ||||||
| Aug. 2026 | YoY | vs. Pre-Pandemic | Aug. 2026 | YoY | vs. Pre-Pandemic | ||
| USA Avg. | 60 | 0 | 1 | 20.4% | 0.0 | 2.8 | |
| Northeast | 52 | 0 | -20 | 14.1% | 1.2 | 0.8 | |
| Midwest | 46 | 1 | -13 | 19.6% | 0.8 | 5.0 | |
| South | 66 | -1 | -5 | 21.4% | -0.4 | 7.5 | |
| West | 60 | 0 | 1 | 22.0% | -0.3 | 7.7 | |
Back to top
Appendix: August 2026 statistics
August 2026 National and Regional Housing Overview
| Region | Active Listing Count, YoY | New Listing Count, YoY | Median List Price | Median List Price, YoY | Median List Price Per SF, YoY | Median Days on Market, Y-Y (Days) | Price Reduced Share | Price Reduced Share, Y-Y (Percentage Points) |
| Northeast | 9.1% | -0.5% | $516,000 | -3.6% | -0.9% | 0 | 14.1% | 1.2 |
| Midwest | 10.5% | -0.5% | $325,000 | 0.0% | 1.8% | 1 | 19.6% | 0.8 |
| South | 1.1% | -0.9% | $380,000 | -2.6% | -2.9% | -1 | 21.4% | -0.4 |
| West | 3.2% | 1.5% | $599,000 | -2.1% | -1.0% | 0 | 22.0% | -0.3 |
| National Average | 3.6% | -0.1% | $424,500 | -1.3% | -1.8% | 0 | 20.4% | 0.0 |
August 2026 Housing Overview of the 50 Largest Metros
| Metro | Active Listing Count YoY | New Listing Count, YoY | Median List Price | Median List Price, YoY | Median List Price per SF, YoY | Median Days on Market, YoY (Days) | Price-Reduced Share | Price-Reduced Share, YoY (Percentage Points) |
| Atlanta-Sandy Springs-Roswell, GA | 3.4% | -3.4% | $419,900 | 1.2% | -0.3% | 2 | 25.0% | -0.2 |
| Austin-Round Rock-San Marcos, TX | 0.3% | 1.2% | $450,000 | -9.8% | -8.1% | 1 | 27.6% | -1.1 |
| Baltimore-Columbia-Towson, MD | 19.2% | 0.7% | $375,000 | -5.5% | -3.2% | 5 | 20.4% | 1.2 |
| Birmingham, AL | 9.9% | 3.0% | $299,850 | 0.0% | -0.4% | 1 | 18.8% | 0.8 |
| Boston-Cambridge-Newton, MA-NH | 15.0% | -0.1% | $795,000 | -0.6% | -1.5% | 6 | 14.8% | -3.0 |
| Buffalo-Cheektowaga, NY | 29.8% | 4.8% | $273,700 | -4.0% | -2.3% | 3 | 11.1% | 1.5 |
| Charlotte-Concord-Gastonia, NC-SC | 15.5% | 0.3% | $429,000 | -2.5% | -1.1% | 4 | 26.0% | 1.2 |
| Chicago-Naperville-Elgin, IL-IN | -6.0% | -7.5% | $395,000 | 5.4% | 3.6% | -1 | 14.6% | -1.8 |
| Cincinnati, OH-KY-IN | 17.1% | -1.2% | $349,900 | 1.1% | -0.7% | 5 | 21.3% | 2.4 |
| Cleveland, OH | 13.6% | 6.0% | $260,000 | -1.8% | 1.6% | 0 | 20.2% | 2.7 |
| Columbus, OH | 10.9% | -1.8% | $379,900 | -0.1% | -0.5% | 3 | 28.2% | 1.3 |
| Dallas-Fort Worth-Arlington, TX | -4.4% | -2.5% | $425,000 | -1.2% | -2.0% | 0 | 27.5% | -0.8 |
| Denver-Aurora-Centennial, CO | 2.1% | 6.4% | $574,900 | -4.2% | -3.4% | -1 | 31.4% | 0.0 |
| Detroit-Warren-Dearborn, MI | 13.6% | 0.8% | $275,000 | -1.4% | 1.7% | 2 | 19.4% | 1.5 |
| Hartford-West Hartford-East Hartford, CT | 1.7% | 2.2% | $459,950 | 2.4% | 3.2% | -2 | 10.1% | 0.3 |
| Houston-Pasadena-The Woodlands, TX | 2.2% | -2.6% | $359,000 | -1.6% | -2.2% | 1 | 21.3% | -0.7 |
| Indianapolis-Carmel-Greenwood, IN | 20.8% | 3.5% | $310,000 | -5.3% | 4.4% | 4 | 28.8% | -0.6 |
| Jacksonville, FL | -16.9% | 5.5% | $380,000 | -4.8% | -2.2% | -9 | 24.3% | -5.6 |
| Kansas City, MO-KS | -0.4% | -4.4% | $390,000 | -0.5% | 1.3% | 0 | 18.8% | 1.4 |
| Las Vegas-Henderson-North Las Vegas, NV | 6.9% | -2.1% | $469,000 | -0.9% | -2.2% | 2 | 24.2% | 0.0 |
| Los Angeles-Long Beach-Anaheim, CA | -0.3% | -2.6% | $1,050,000 | -4.5% | -2.1% | 0 | 16.6% | -0.2 |
| Louisville/Jefferson County, KY-IN | 25.4% | -0.2% | $315,000 | -1.6% | 0.7% | 5 | 23.3% | 1.8 |
| Memphis, TN-MS-AR | 9.8% | -5.4% | $299,990 | -9.9% | -4.1% | 4 | 25.3% | 1.4 |
| Miami-Fort Lauderdale-West Palm Beach, FL | -15.0% | -1.0% | $490,000 | -2.0% | -0.8% | -5 | 14.6% | -2.8 |
| Milwaukee-Waukesha, WI | 10.7% | 2.8% | $399,900 | 0.0% | 2.6% | 4 | 15.6% | 0.4 |
| Minneapolis-St. Paul-Bloomington, MN-WI | 32.9% | 13.3% | $419,900 | -3.1% | -2.1% | 0 | 20.3% | 3.3 |
| Nashville-Davidson–Murfreesboro–Franklin, TN | 12.6% | 0.6% | $539,900 | 0.0% | -0.8% | 1 | 22.0% | 0.8 |
| New York-Newark-Jersey City, NY-NJ | 3.2% | -1.7% | $749,000 | -1.4% | -0.5% | -2 | 10.2% | 2.3 |
| Oklahoma City, OK | 7.8% | -10.1% | $314,000 | -1.9% | 0.1% | 5 | 23.8% | 0.9 |
| Orlando-Kissimmee-Sanford, FL | -2.5% | 5.4% | $415,000 | -1.9% | -2.6% | -2 | 23.3% | -0.3 |
| Philadelphia-Camden-Wilmington, PA-NJ-DE-MD | 13.3% | 1.4% | $374,900 | -1.3% | -0.6% | 4 | 16.7% | 1.2 |
| Phoenix-Mesa-Chandler, AZ | 5.2% | 0.6% | $475,000 | -4.8% | -1.4% | -3 | 27.6% | -0.8 |
| Pittsburgh, PA | 15.0% | 0.8% | $249,900 | -1.6% | 0.1% | 3 | 20.8% | 0.6 |
| Portland-Vancouver-Hillsboro, OR-WA | 2.8% | -1.7% | $595,000 | -0.7% | -2.4% | 1 | 30.5% | -0.3 |
| Providence-Warwick, RI-MA | 16.1% | 4.9% | $589,000 | -1.7% | 9.3% | 1 | 12.1% | 0.3 |
| Raleigh-Cary, NC | 6.2% | -2.1% | $450,000 | -1.1% | -2.3% | 4 | 24.1% | -0.8 |
| Richmond, VA | 20.9% | 9.3% | $440,000 | 2.4% | 1.5% | -2 | 17.0% | -0.2 |
| Riverside-San Bernardino-Ontario, CA | -4.4% | 1.5% | $589,900 | -1.5% | -1.4% | -3 | 18.4% | -0.2 |
| Sacramento-Roseville-Folsom, CA | -4.3% | 3.8% | $615,000 | -0.8% | -0.7% | -1 | 22.3% | -0.5 |
| St. Louis, MO-IL | 16.6% | -0.8% | $289,900 | -3.4% | -1.2% | 0 | 19.7% | 2.6 |
| Salt Lake City-Murray, UT | 10.9% | 8.4% | $567,000 | -2.7% | 0.6% | -1 | 30.3% | -0.6 |
| San Antonio-New Braunfels, TX | 3.8% | 0.0% | $324,000 | -1.8% | -3.6% | 0 | 28.0% | 1.2 |
| San Diego-Chula Vista-Carlsbad, CA | -4.9% | 5.5% | $899,000 | -5.4% | -2.9% | 0 | 20.0% | -1.5 |
| San Francisco-Oakland-Fremont, CA | -13.0% | 0.0% | $911,375 | -5.0% | -3.8% | -7 | 13.9% | -0.9 |
| San Jose-Sunnyvale-Santa Clara, CA | 9.0% | 16.6% | $1,349,000 | -2.1% | -1.3% | -4 | 14.6% | 0.1 |
| Seattle-Tacoma-Bellevue, WA | 27.3% | 10.2% | $750,000 | -3.2% | -1.8% | 1 | 23.1% | 3.1 |
| Tampa-St. Petersburg-Clearwater, FL | -6.4% | -1.4% | $390,000 | -6.0% | -5.6% | -3 | 25.5% | -2.0 |
| Tucson, AZ | -0.6% | 9.8% | $374,900 | -2.6% | -2.5% | -1 | 20.6% | -1.9 |
| Virginia Beach-Chesapeake-Norfolk, VA-NC | 12.2% | 12.9% | $434,000 | 5.1% | 2.9% | -1 | 22.6% | -0.2 |
| Washington-Arlington-Alexandria, DC-VA-MD-WV | 13.8% | 2.5% | $565,000 | -5.8% | -2.1% | 4 | 19.0% | 1.5 |
Methodology
Realtor.com housing data as of August 2026. Listings include the active inventory of existing single-family homes and condos/townhomes/row homes/co-ops for the given level of geography on Realtor.com; new construction is excluded unless listed via an MLS that provides listing data to Realtor.com. Realtor.com data history goes back to July 2016. The 50 largest U.S. metropolitan areas as defined by the Office of Management and Budget (OMB-202301) and Claritas 2025 estimates of household counts.
Beginning with our April 2025 report, we have transitioned to a revised national pending home sales data series that applies enhanced cleaning methods to improve consistency and accuracy over time. While the insights and commentary in this report reflect the new series, the downloadable data remains based on our legacy automated pipeline. As a result, there may be slight differences between the report figures and those in the national download file as we transition.
With the release of its January 2025 housing trends report, Realtor.com has restated data points for some previous months. As a result of these changes, some of the data released since January 2025 will not be directly comparable with previous data releases (files downloaded before January 2025) and Realtor.com economics research reports.
Contract signings represent the flow of homes entering pending status in a given month (i.e., homes that went under contract for the first time in that period). This is a flow measure, not a stock measure. This distinguishes it from the stock of pending listings, which measures the total number of homes under contract at a given point in time regardless of when they entered that status.