

Highlights
- Community Development Block Grants (CDBG) are federal funds from the Department of Housing & Urban Development (HUD) given to cities to supplement infrastructure funding, housing and economic development programs, and public services. The recently enacted 21st Century ROAD to Housing Act ties CDBG bonuses and penalties to growth in each recipient community’s housing stock.
- For some cities, CDBG money serves as an essential funding source. For most, these incentives will lack impact, as the median city receives CDBG money equivalent to just 1/300th of their budget and the penalty for underbuilding is just 10% of that grant amount.
- The cities where the impact could be largest (where CDBG funding is significant and current homebuilding levels are low) tend to be Northeastern and Midwestern markets. These are the regions where homebuilding is needed the most.
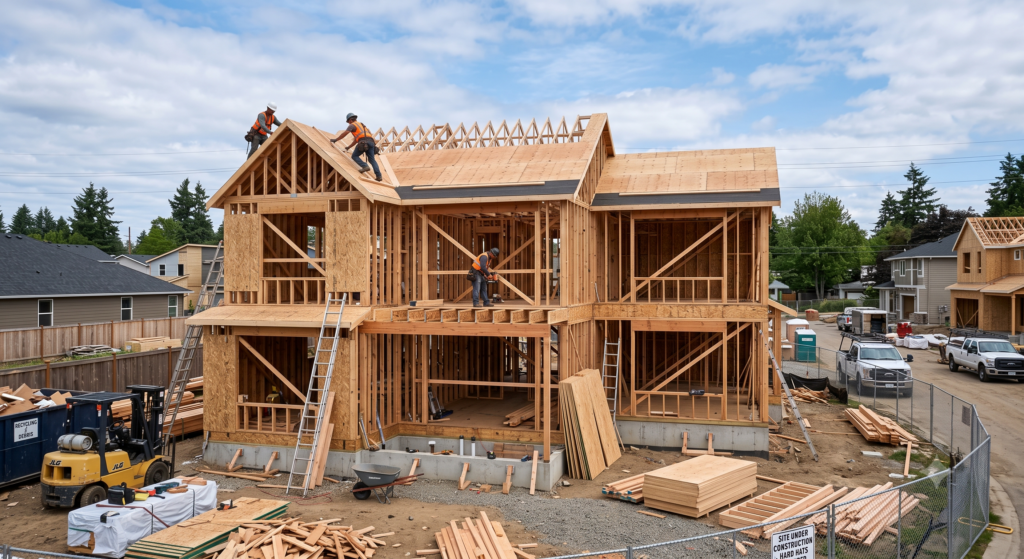
Among other tactics in the 139 page text, the recently enacted 21st Century ROAD to Housing Act introduces a transformative shift in federal housing strategy by leveraging Community Development Block Grant (CDBG) funds to incentivize residential construction. Under this new framework, the Department of Housing & Urban Development (HUD) will tie CDBG allotments directly to local housing growth. Municipalities that successfully expand their housing inventory will see their grant allocations grow, while those failing to meet delivery standards risk reductions. This pivot transforms CDBGs from traditional development tools into the primary currency of a national incentive system designed to streamline permitting and modernize local zoning laws.
To evaluate the potential impact of this award system, this report analyzes the current CDBG landscape. By comparing 2023 HUD grant data with Census Bureau budget and population statistics, we identify the jurisdictions most reliant on these funds. Understanding where CDBG reliance is highest highlights the areas likely to be most responsive to these new homebuilding incentives.
What are CDBG funds used for and why do policymakers like them?
The defining feature of the CDBG program is its operational flexibility. Eligible activities are broadly categorized into four pillars. Infrastructure and Public Facilities supports essential works like water lines, street repairs, and community centers. Housing focuses on rehabilitating existing units, lead abatement, and buyer assistance. Economic Development provides small business capital and corridor revitalization. Finally, Public Services—capped at 15% of the total allocation—funds vital social programs including childcare and senior services.
Policymakers like CDBG because of the local control. Cities and counties are making the decisions on how to spend the grant money rather than having Washington determine that from afar. CDBG funds, which are allocated based on a statutory formula using population, poverty, and housing statistics, are quite predictable from year to year, giving policymakers a longer planning horizon. This appealing aspect of the program could be compromised for cities that fail to meet home building standards under the new housing bill, though.
How much money do cities get?
Current data suggests that for many large municipalities, CDBG awards represent a marginal share of total revenue. In 2023, the median grant-to-revenue ratio was just 0.33%. This “1/300th” share of a typical city budget raises questions about the efficacy of the proposed incentives. For instance, in Los Angeles—which maintains a total revenue of approximately $22 billion—the maximum 10% penalty for underperformance would amount to roughly $5 million, a figure unlikely to drive significant policy overhauls in a multi-billion dollar budget.
Total CDBG funding by HUD has not kept pace with inflation since the program was created in 1974, and the number of eligible recipients has grown, which explains why we find that the current awards are so meager. The median grant amount among the cities we identified was just $839,525. This means that the median penalty for a city that does not meet its homebuilding growth goal is about $84,000.
Where does the money go?
The biggest recipients of CDBG funds are the biggest cities in terms of population, and the distribution of money is skewed heavily in favor of these large cities. New York City alone received $169.3 million, more than double the next-largest recipient, Chicago.
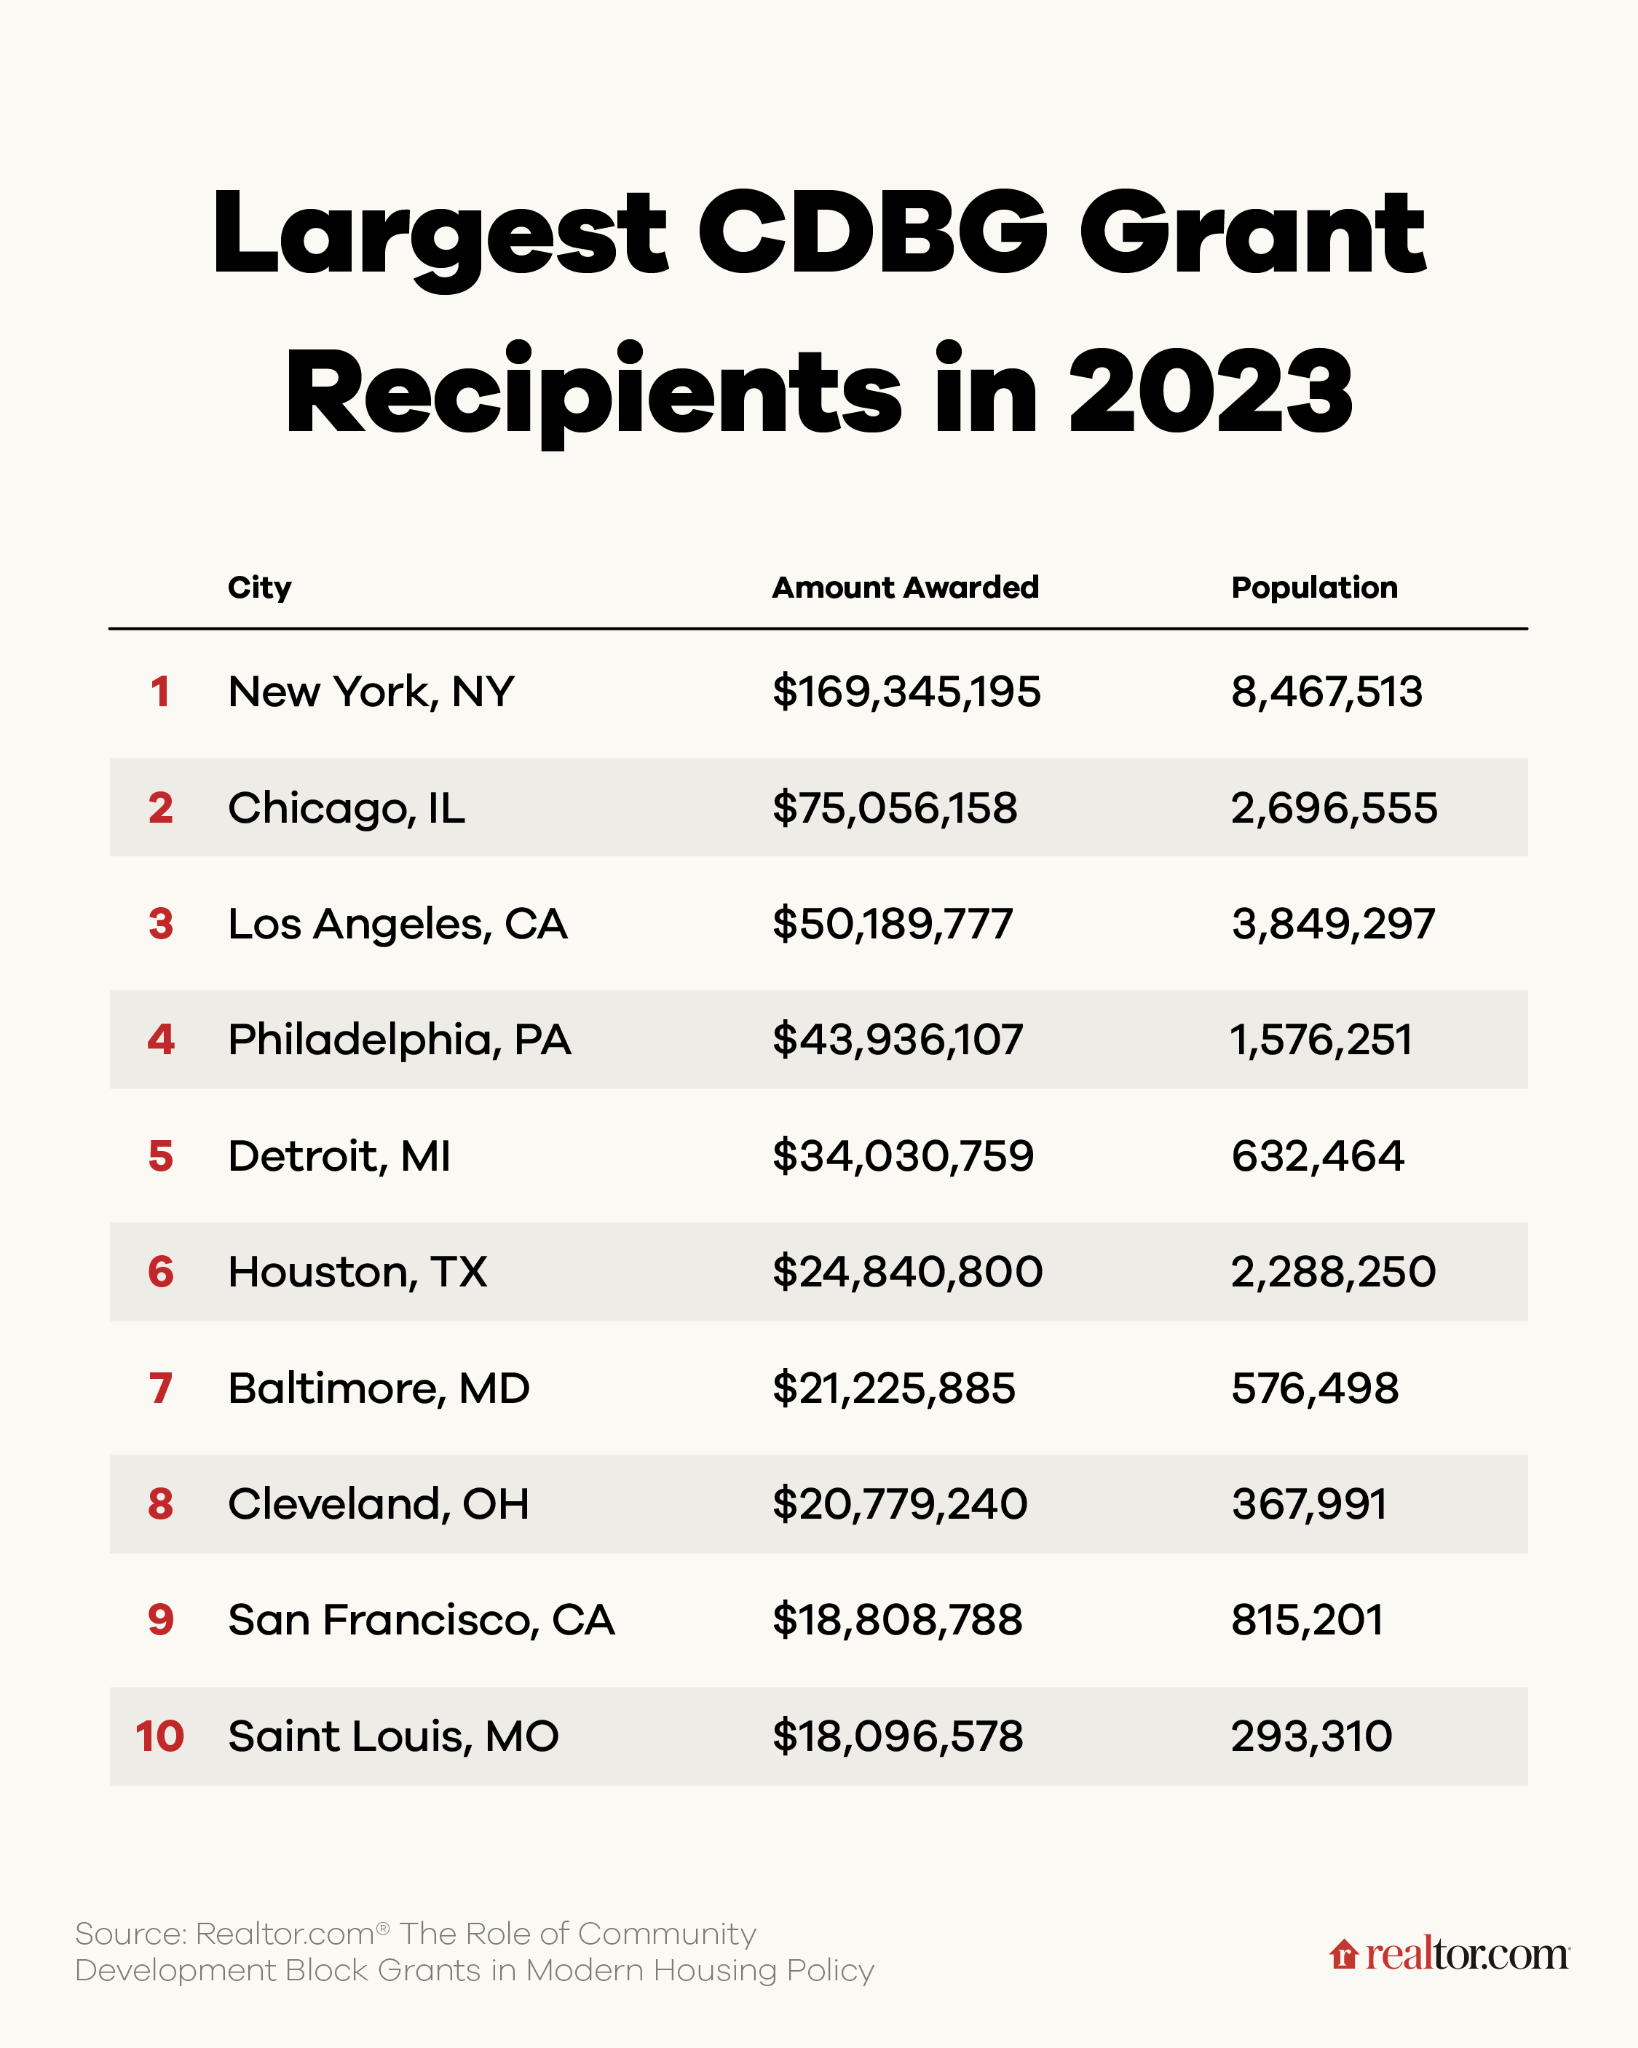
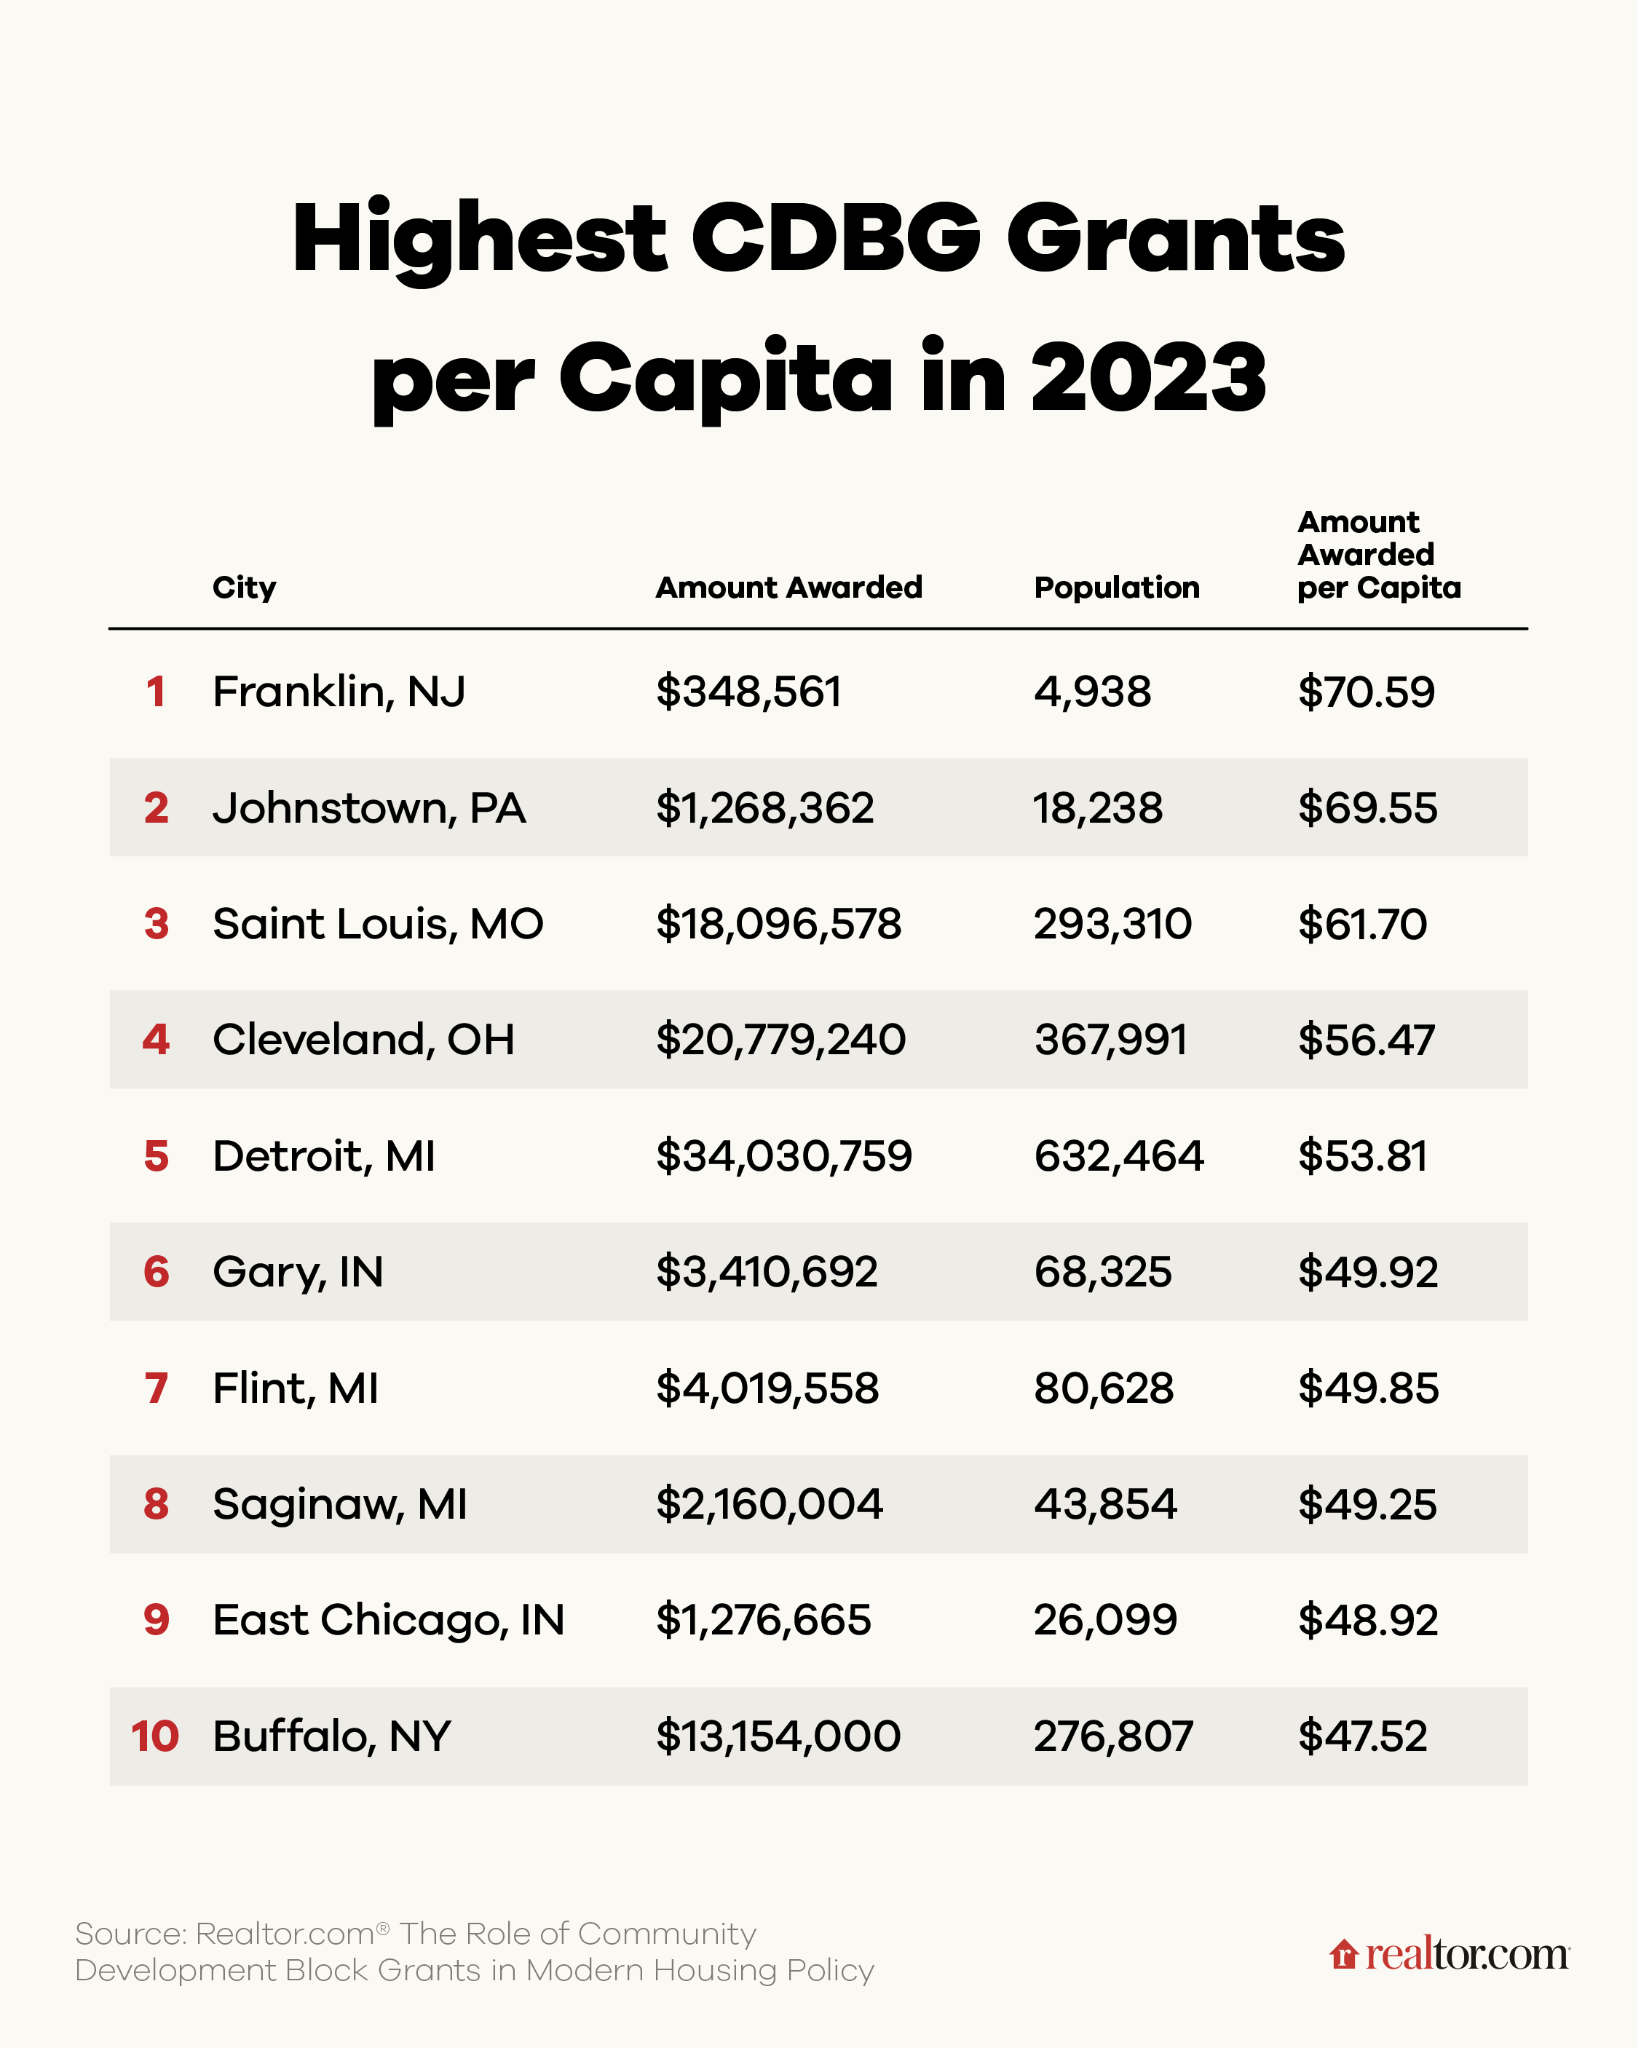
Though these cities may receive the lion’s share of CDBG funding, they may not all be the places where the impact of the grant is felt most acutely. On a per capita basis, the cities receiving the most funding adjusted for population tend to be smaller and more traditionally industrial.
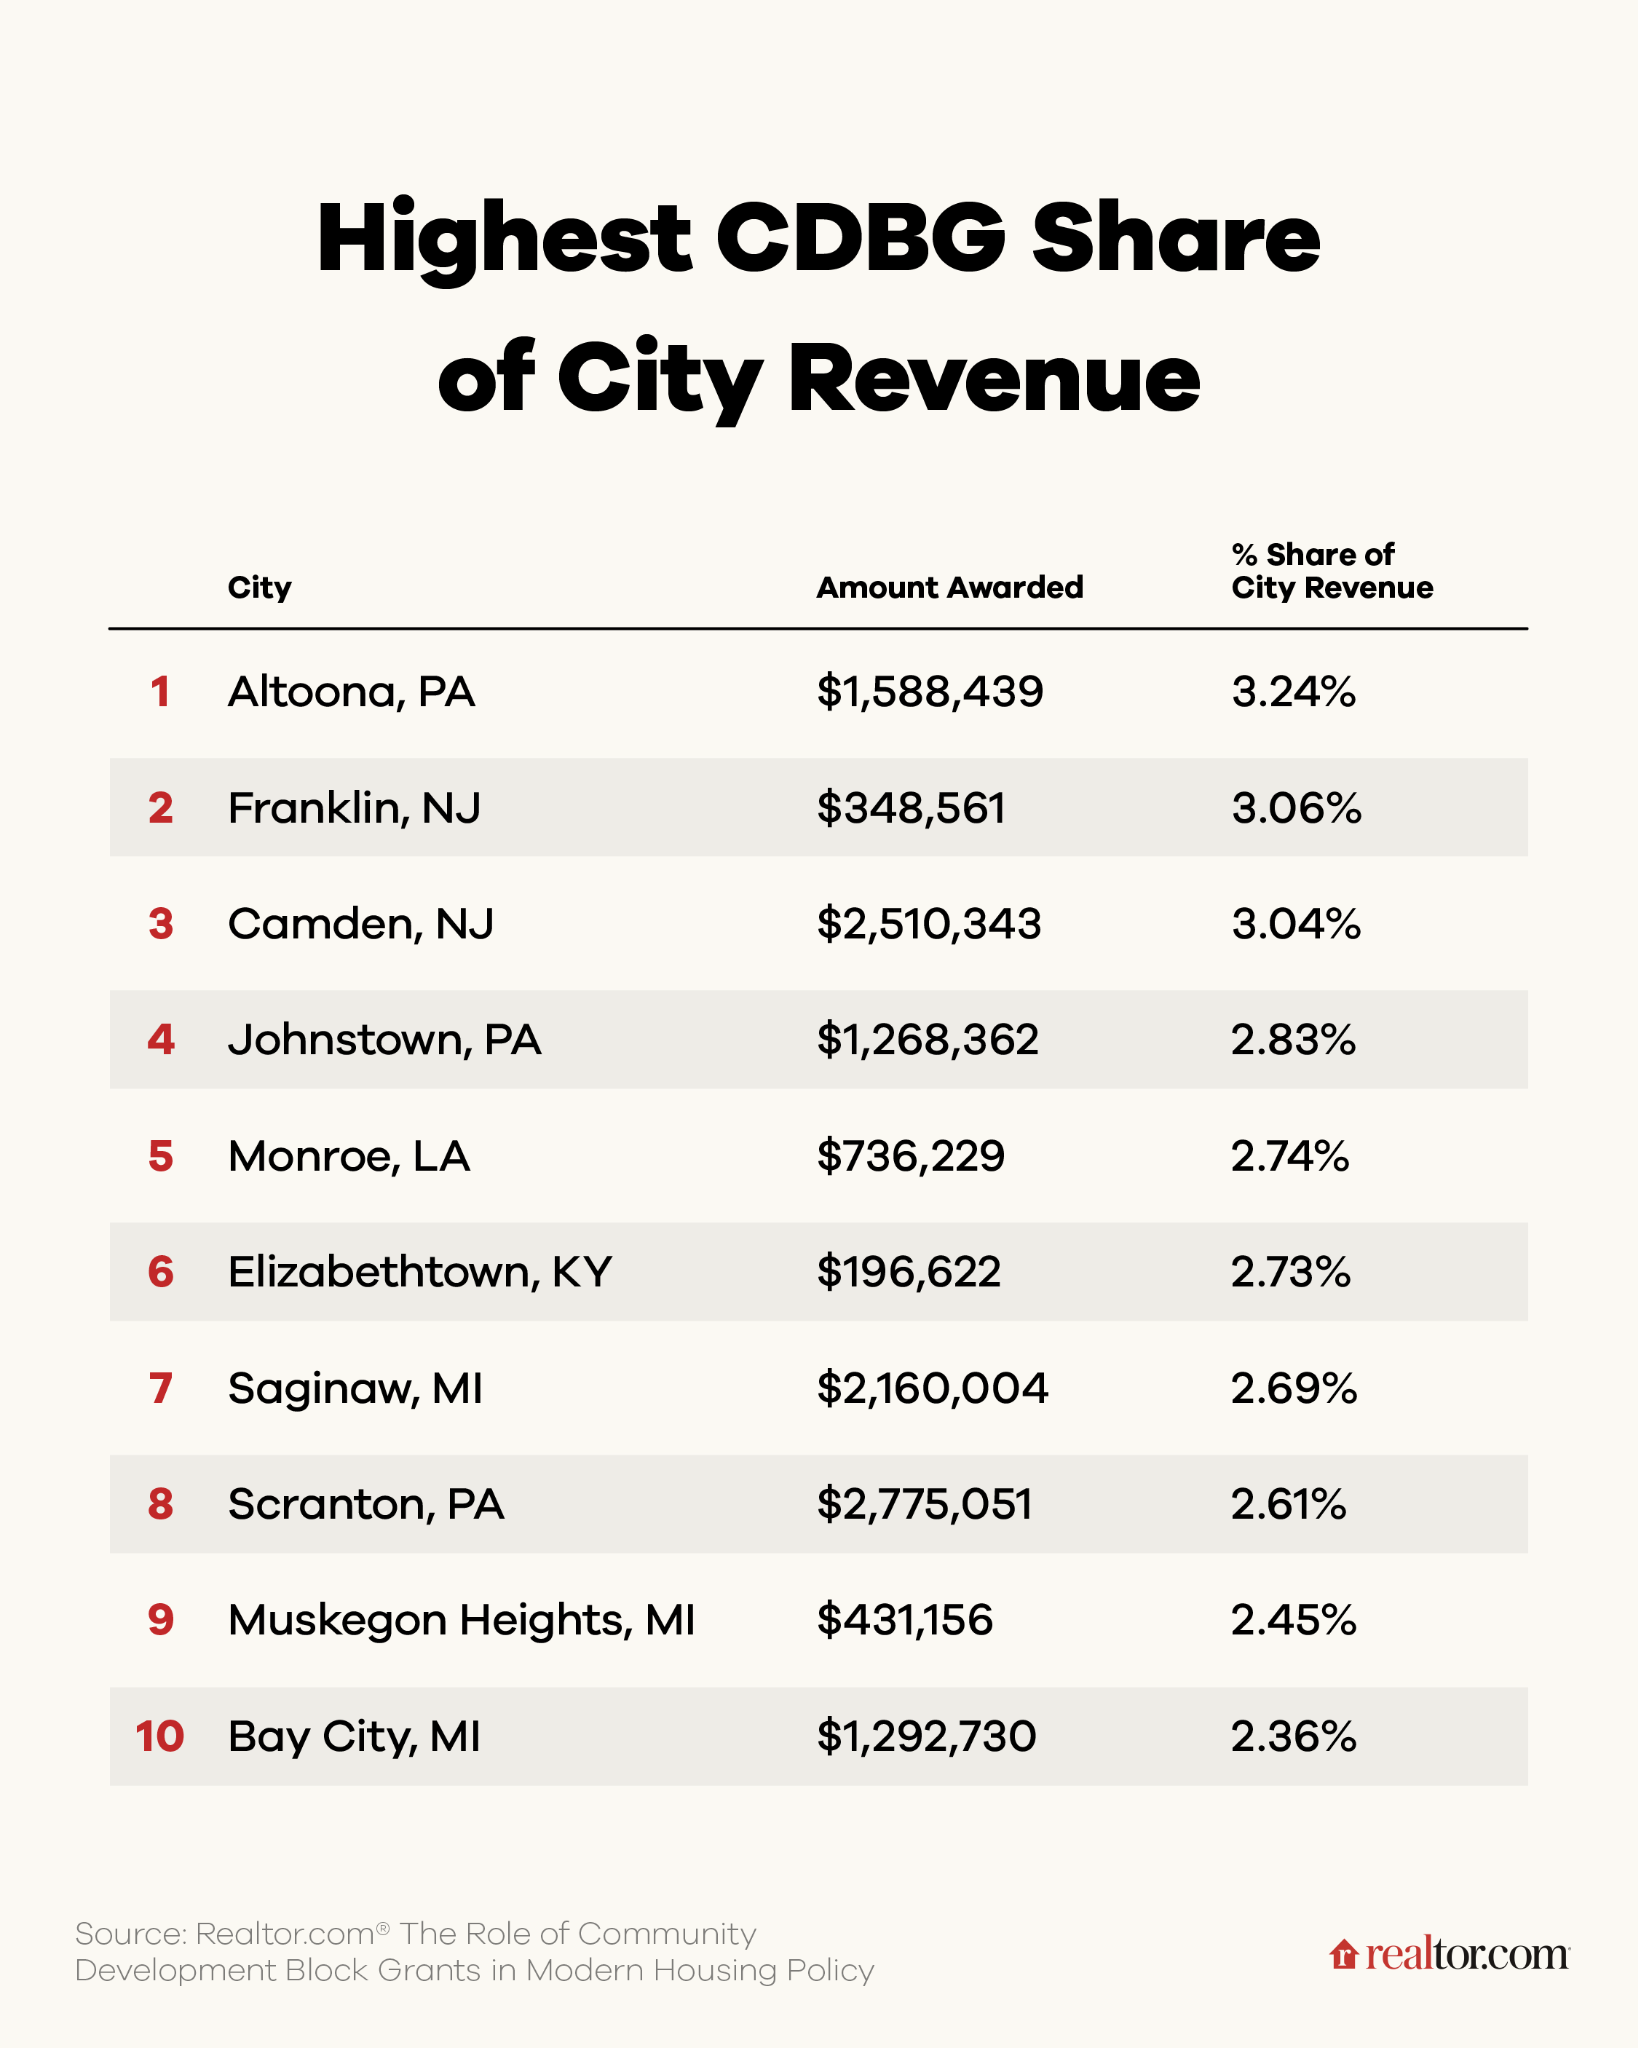
As a share of city budgets, CDBG is a minor line item for most cities. The median city in our sample receives CDBG equal to 0.33% of total revenue, with three-quarters of cities below 0.54%. The cities where the CDBG award is a larger share of total revenue may be the places where the carrot-and-stick system of homebuilding incentives has the most impact. These are below.
What is the relationship to new construction?
Both CDBG per capita and CDBG as a share of city revenue have a weak negative correlation with the new construction share of listings in the city. The cities that have an outsized impact from CDBG tend not to build as many homes right now, which means that the incentive system may have a larger effect in the places where homebuilding is currently the least active. This could be a good thing, if regulatory burden is what is keeping homes from being built and the cities make good faith moves to reduce that burden and keep their CDBG money. It could also be the case that these cities are not growing fast enough to require increased homebuilding, and that their much-relied-upon CDBG funds are in jeopardy unless they build homes that are not needed.
Fortunately, certain CDBG grantees are exempted from the payout tournament. Jurisdictions are exempt if they lack statutory zoning authority, have high rental vacancy rates, have low fair market rents, or sit within a federally declared disaster area from the preceding 365 days. This ensures that localities with little ability to change their outcome, weak housing demand, or recent natural disasters are not penalized for failing to increase their housing growth rate.
To find the cities where this system of incentives is most likely to have a positive impact, we looked for cities with two characteristics, focusing on large cities of over 250,000 residents. First, we seek cities whose CDBGs make up a high percentage of their annual revenue, so that increases or decreases to the grant are meaningful. Second, we seek cities that have a low baseline for homebuilding, as measured by the new construction share of for-sale listings on the market. We ranked the cities on these criteria and averaged the scores to produce the ten cities where the incentive provisions of the new housing bill might have the largest impact.
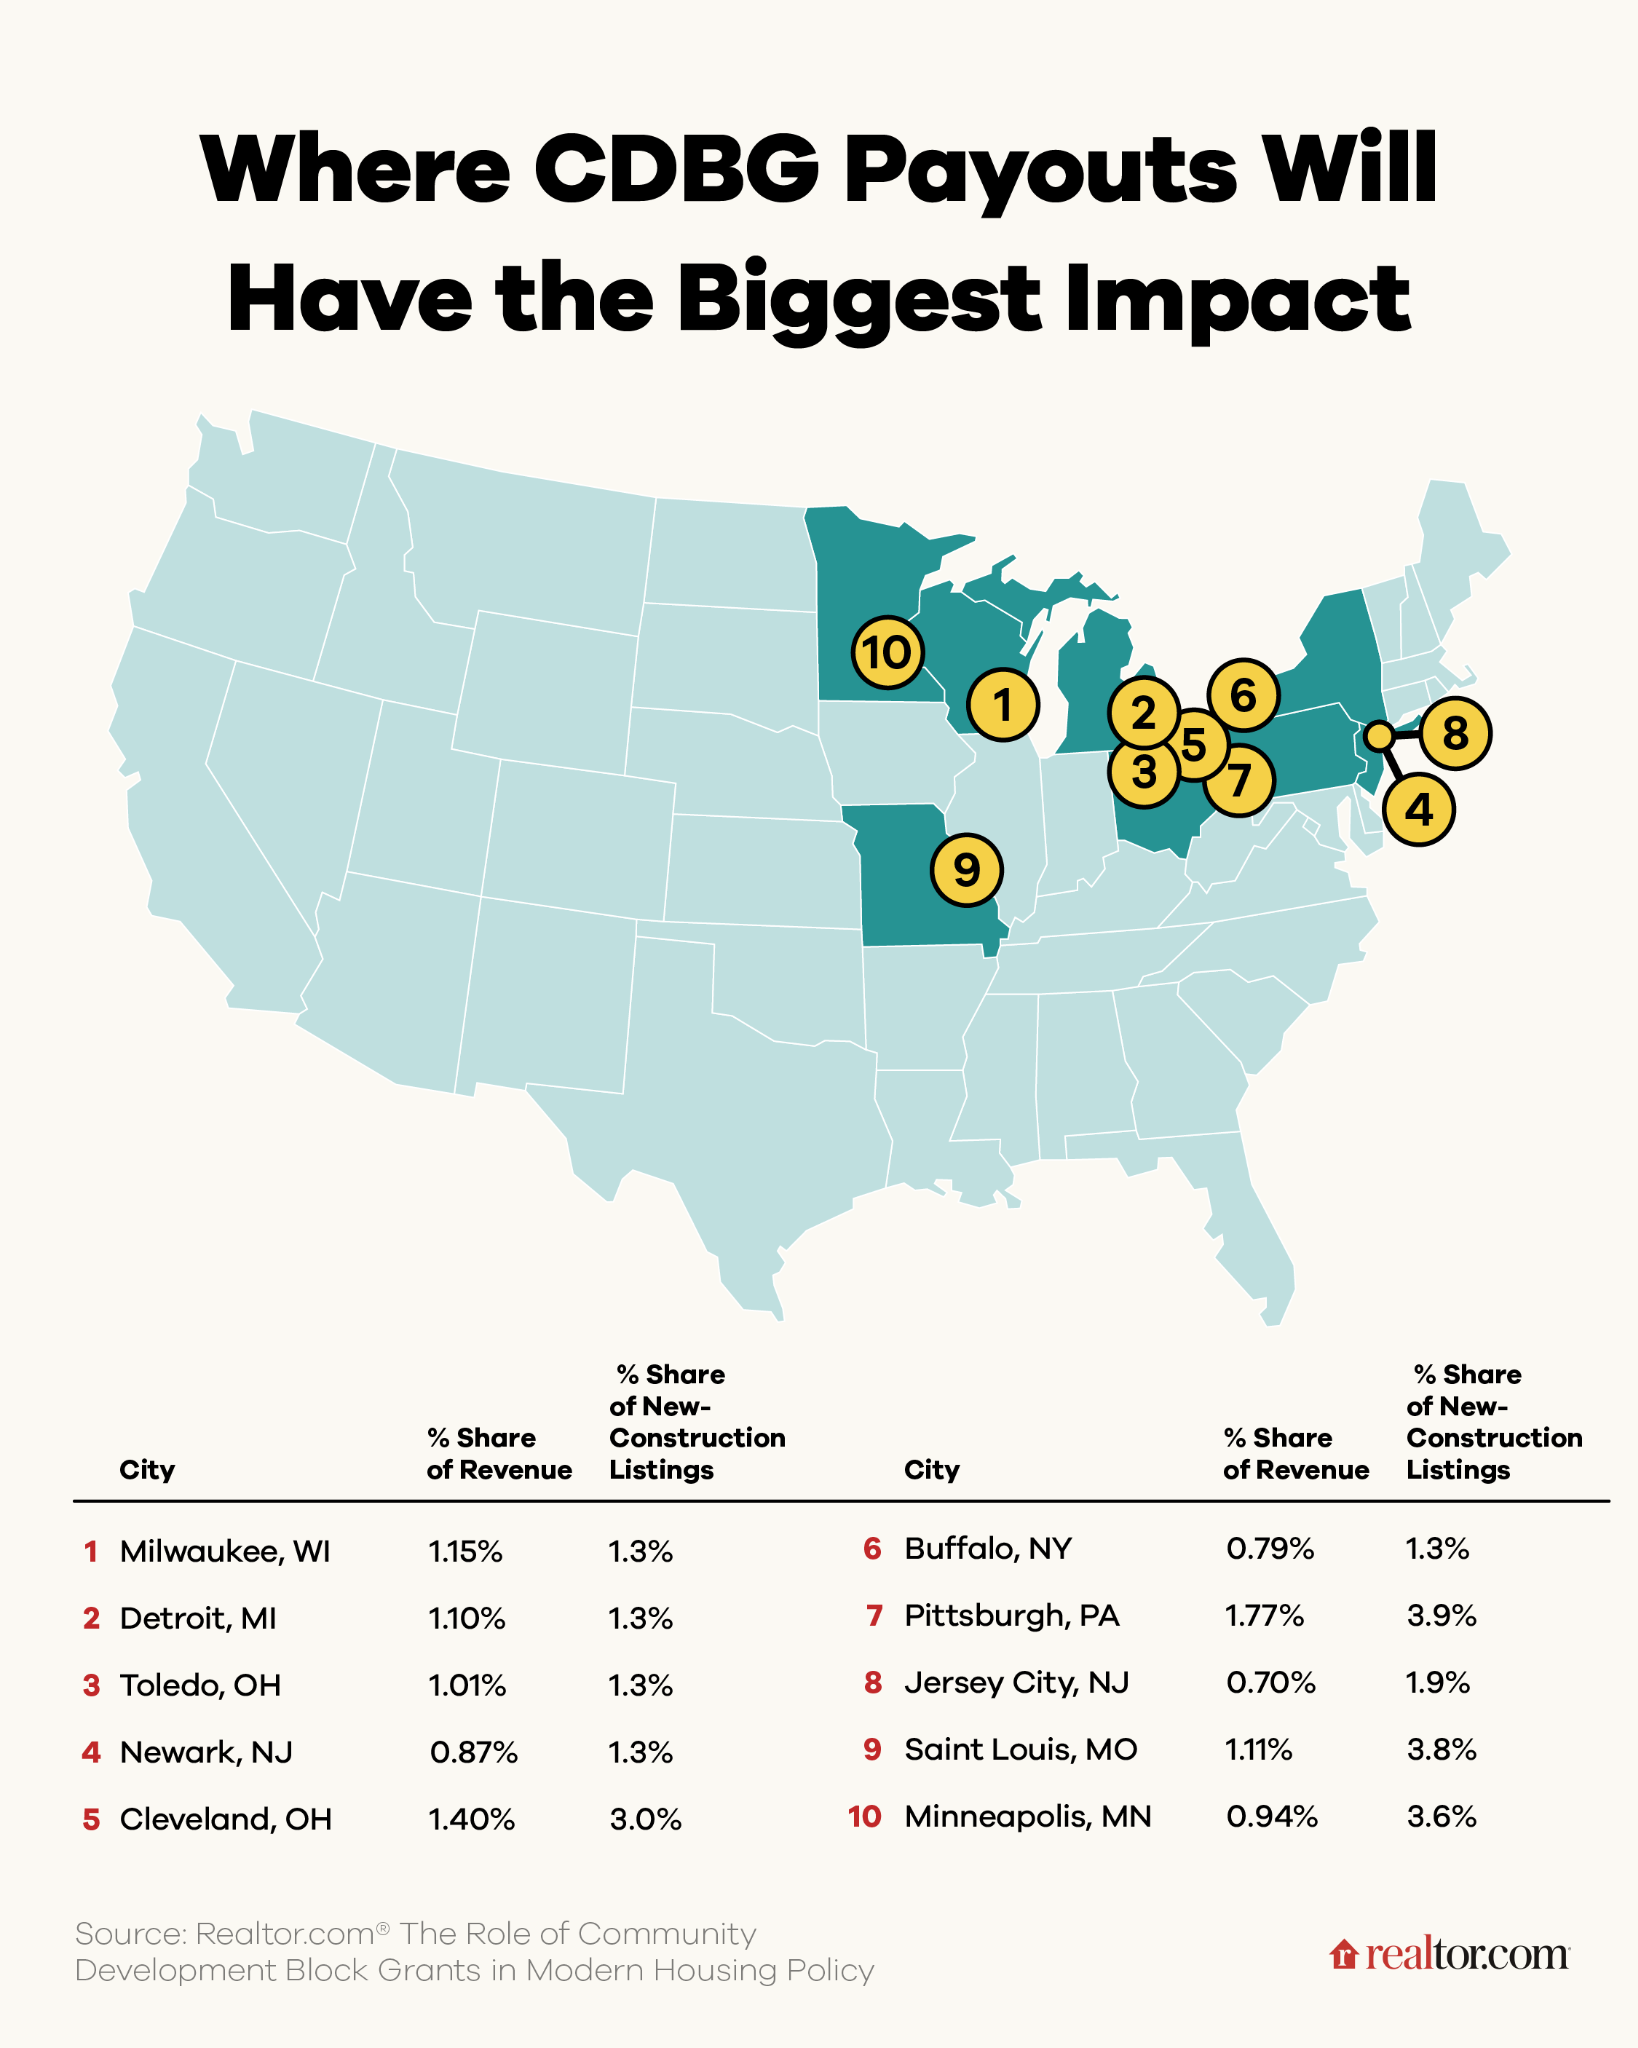
We find that while CDBG funds remain a minor budgetary component for the nation’s largest cities, they represent a critical funding source for smaller, post-industrial markets in the Midwest and Northeast. These regions maintain a significant new construction premium, signaling a high demand for affordable inventory that current homebuilding rates are failing to meet. By targeting markets where CDBG reliance is highest and existing homebuilding is least active, the 21st Century ROAD to Housing Act has the potential to unlock stalled development.
Four of these ten cities have household counts growing faster than the country at large (1.6%), indicating a clear and present need for additional housing. Two are Midwestern: Minneapolis (1.9%) and Detroit (1.7%). Two are rapidly growing New Jersey cities: Jersey City (6.3%) and Newark (5.6%). As we have shown in our research on the housing supply gap, the cities with slower household formation need additional housing as well. Affordability constraints are slowing household formation across the country, so these cities could have stronger household growth rates if only their residents could afford to strike out on their own, which would be enabled by a higher level of home construction.
The Act was lauded for appropriating no new funds, and even this CDBG payout system is self-funding (the penalties pay for the bonuses). For the system to be effective though, the stakes need to be higher than 1/300th of the city budget, which requires Congress to pass additional funding for it.
Methodology
Community Development Block Grant amounts for 2023 come from this tracker provided by HUD. City budget data come from the Census Bureau datasets. New construction data is a trailing 12-month average as of June 2026 based on new and existing home listings on Realtor.com. Household growth comes from counts provided by Claritas for 2026 and 2025.