


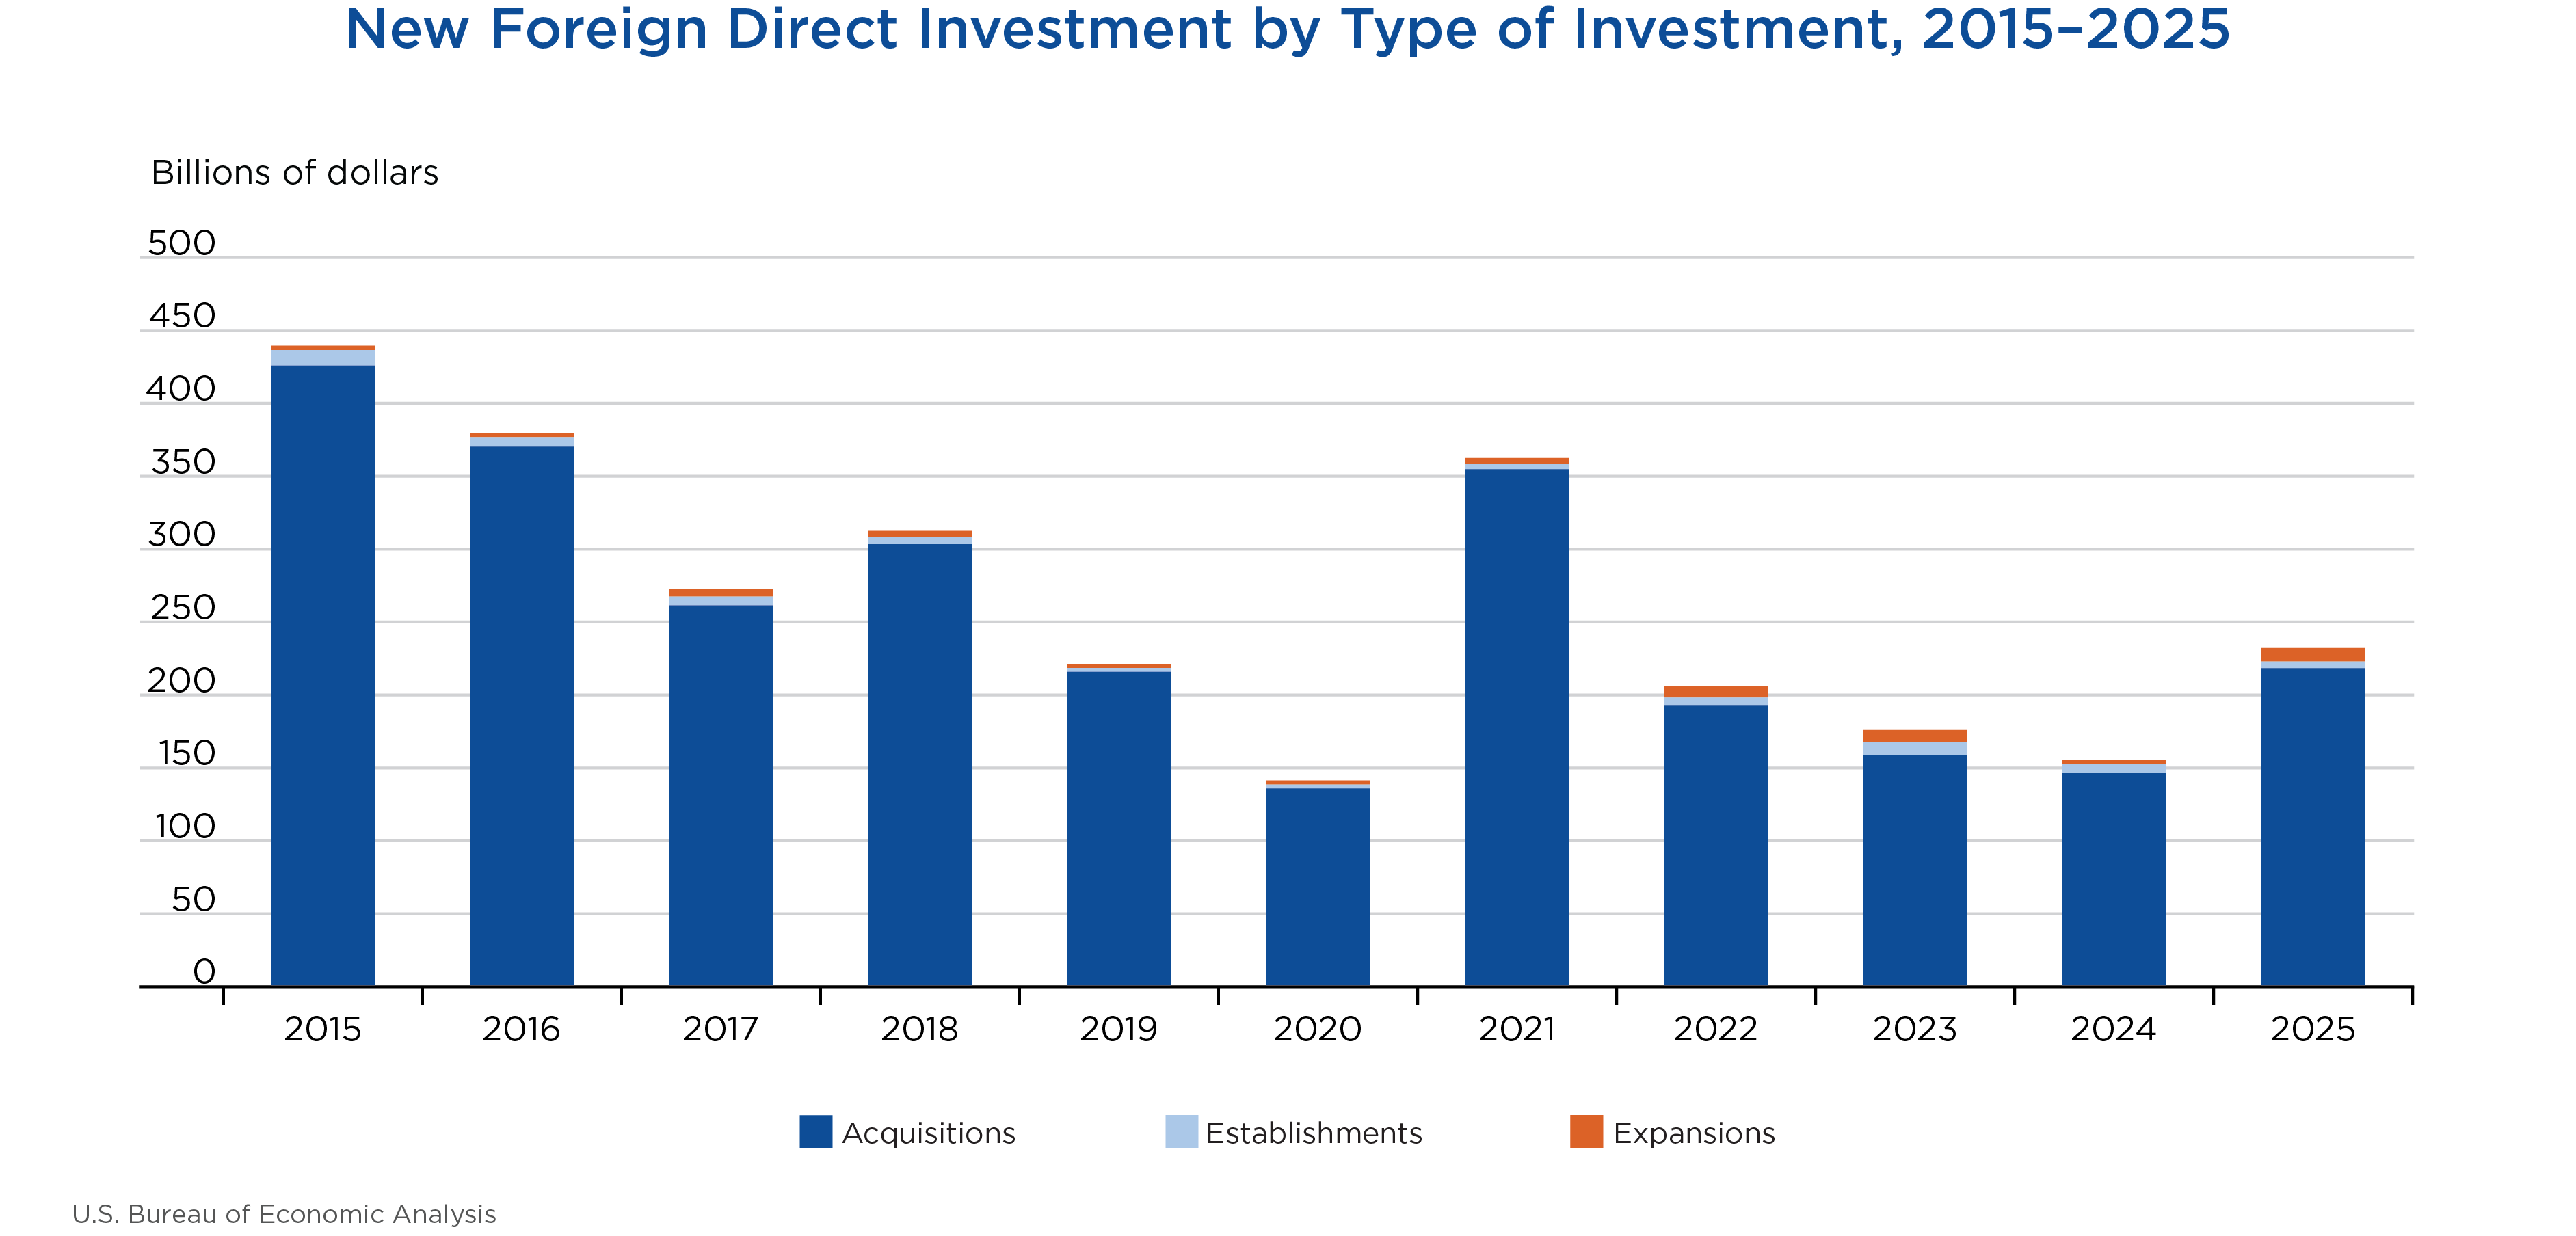
Expenditures by foreign direct investors to acquire, establish, or expand U.S. businesses totaled $232.2 billion in 2025, according to preliminary statistics released today by the U.S. Bureau of Economic Analysis. Expenditures increased $76.8 billion, or 49.5 percent, from 2024 levels. As in previous years, acquisitions of existing U.S. businesses accounted for most of the expenditures.
Acquisition expenditures in 2025 were $218.4 billion, expenditures to establish new U.S. businesses were $4.6 billion, and expenditures to expand existing foreign-owned businesses were $9.2 billion. Planned total expenditures, which include both first-year and planned future expenditures, were $284.5 billion.
Employment in 2025 at newly acquired, established, or expanded foreign-owned businesses in the United States was 213,100 employees.
Expenditures by industry, country, and state
By industry, expenditures for new direct investment were largest in publishing industries ($50.7 billion), followed by chemicals manufacturing ($45.4 billion) and plastics and rubber products manufacturing ($19.0 billion). The manufacturing sector ($121.8 billion) accounted for 52.5 percent of total expenditures.
The country with the largest investment was Japan ($50.5 billion), followed by Germany ($26.7 billion) and Canada ($23.5 billion).1 By region, Europe contributed the most new investment, $116.6 billion, or 50.2 percent of all new investment in 2025. Asia and Pacific was the second-largest investing region, with $71.9 billion in expenditures.
By state, California received the most investment in 2025, with $59.7 billion in first-year investment expenditures, followed by Texas ($21.5 billion) and Pennsylvania ($20.9 billion).
Greenfield expenditures
Greenfield investment expenditures—expenditures to establish a new U.S. business or to expand an existing foreign-owned U.S. business—were $13.8 billion in 2025. By industry, greenfield expenditures were largest in transportation and warehousing ($3.6 billion), computers and electronics products manufacturing ($2.0 billion), and chemicals manufacturing ($1.8 billion). By region, investors from Asia and Pacific contributed the highest dollar value of greenfield expenditures ($8.3 billion), led by Australia ($3.0 billion), South Korea ($2.2 billion), and Japan ($1.7 billion). By state, Louisiana ($3.0 billion), Arizona ($2.7 billion), and Texas ($1.9 billion) received the highest levels of greenfield investment.
Planned total expenditures for greenfield investment initiated in 2025, which include both first-year and planned future expenditures, were $66.1 billion.
Employment by industry, country, and state
In 2025, current employment of acquired enterprises was 211,700. Total planned employment, which includes the current employment of acquired enterprises, the planned employment of newly established business enterprises when fully operational, and the planned employment associated with expansions, was 232,400.
By industry, plastics and rubber parts manufacturing accounted for the largest number of current employees (21,800), followed by transportation equipment manufacturing (17,300) and primary and fabricated metals manufacturing (16,400). Mexico (54,600), Canada (29,500), and the United Kingdom (26,800) accounted for the largest number of current employees by country. California (37,200) was the state with the largest current employment resulting from new investment, followed by Illinois (17,600) and Texas (16,500).
| Previously Published | Revised | |
|---|---|---|
| First-year expenditures | 151.0 | 155.3 |
| U.S. businesses acquired | 143.0 | 146.4 |
| U.S. businesses established | 6.3 | 6.4 |
| U.S. businesses expanded | 1.8 | 2.5 |
| Planned total expenditures | 157.0 | 164.0 |
| U.S. businesses acquired | 143.0 | 146.4 |
| U.S. businesses established | 7.8 | 8.2 |
| U.S. businesses expanded | 6.2 | 9.4 |
| U.S. Bureau of Economic Analysis | ||
Related Data Tables
For the 2025 new foreign direct investment statistics highlighted in this release, as well as estimates for earlier years, see the below data tables in “Supplemental Data.”
First-year and planned total expenditures
First-Year and Planned Total Expenditures, Industry of Affiliate by Type of Investment
First-Year and Planned Total Expenditures, Country of UBO by Type of Investment
First-Year and Planned Total Expenditures, State by Type of Investment
First-Year and Planned Total Expenditures, Industry of UBO by Type of Investment
First-Year and Planned Total Expenditures, by Industry of Affiliate (All Industries)
First-Year and Planned Total Expenditures, by Country of UBO (All Countries)
First-Year Expenditures, Country of UBO by Industry of Affiliate
First-Year Expenditures, Country of Foreign Parent and UBO
Planned Total Expenditures for Establishments and Expansions, by Type of Expenditure
Greenfield investments (expenditures for U.S. businesses established and expanded)
Planned Expenditures for Greenfield Investments, Type of Investment by Year
Planned Expenditures for Greenfield Investments, Industry of Affiliate by Year
Planned Expenditures for Greenfield Investments, Country of UBO by Year
Planned Expenditures for Greenfield Investments, State by Year
Expenditures for Greenfield Investments, Year of Investment Expenditure by Year Investment Was Initiated
Employment
Current and Planned Employment, Industry of Affiliate by Type of Investment
Current and Planned Employment, Country of UBO by Type of Investment
Current and Planned Employment, State by Type of Investment
No longer produced: Number of investments by size (supplemental data tables)
Number of investments initiated, Distribution of Planned Total Expenditures, Size by Type of Investment
Note. BEA has updated its disclosure avoidance method to coarsening, which includes rounding, aggregation, and the use of ranges. This allows BEA to publish more data, while still providing confidentiality to BEA’s survey respondents. BEA did not use cell suppression or noise infusion.
Next release: June 2027
New Foreign Direct Investment in the United States, 2026
1 As measured by country of ultimate beneficial owner (UBO; see “Additional Information” for a description).


