




JLGutierrez/iStock via Getty Images
The S&P 500 is trading at 18.8X forward earnings and 26.15X trailing earnings. By both measures, it’s well above historical norms. Its true valuation is even higher as earnings are being artificially inflated by the delta in timing recognition of earnings vs. expenses related to AI capex. In brief, earnings are being fully recognized in year 0, while only a fraction of expenses are hitting the income statement.
Historical valuation
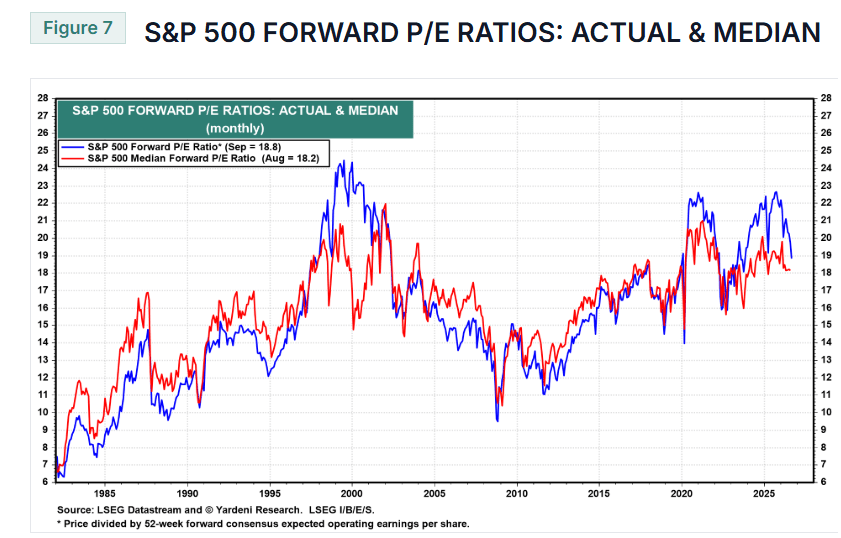
Yardeni Research shows S&P 500 forward multiples at 18.8X. Note on the graph below that valuations only got this high briefly during the pandemic (due to earnings dropping) and during the dot-com bubble.
Yardeni
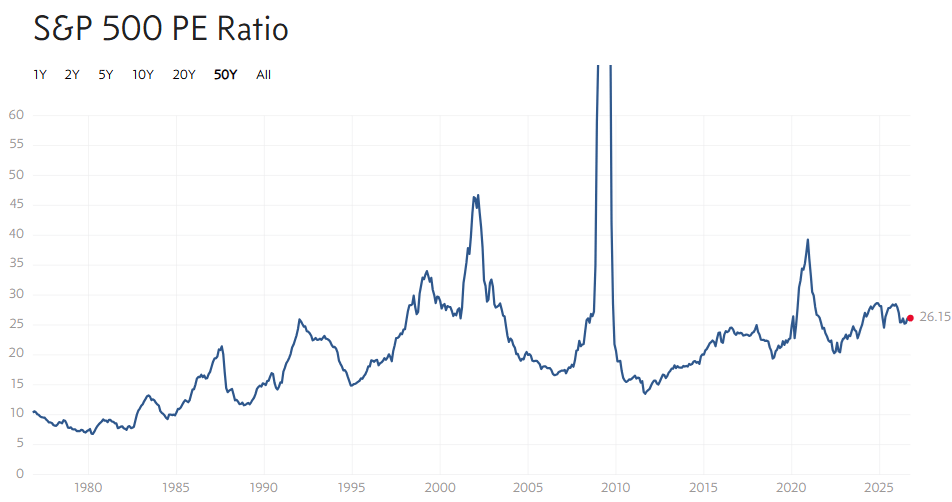
Trailing valuation shows a similar story, with the 26.15X trailing multiple only surpassed by three time periods:
- Pandemic earnings crash (low earnings = high multiple).
- Dot-com bubble (outrageous valuation).
- 2008 Great Financial Crisis (low earnings).
multpl.com
This high valuation in 2008-2009 did not show up in the graph of the forward multiple because earnings estimates remained positive at that time. It shows up in the trailing multiple because actual earnings cratered during the crisis.
While current multiples are high, I posit that they’re actually substantially higher if one adjusts for the distortion resulting from depreciation schedules.
S&P 500 Earnings Breakdown
According to Morningstar, the S&P constituent total market cap is $65.93 trillion. Thus, the 18.8 forward multiple implies forward earnings of $3.5T.
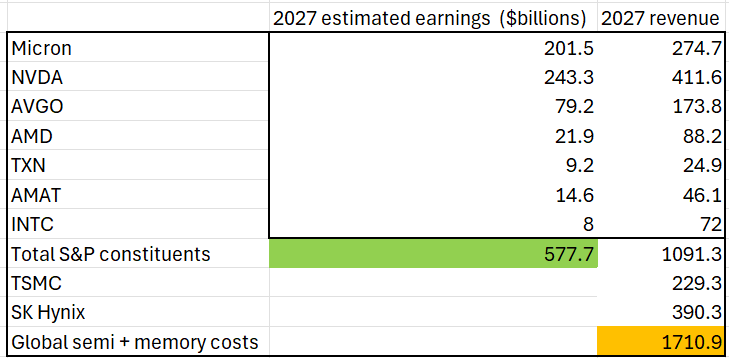
Of that $3.5T, about $577.7B comes from chip and memory companies.

2MC
That represents about 16.5% of overall S&P 500 earnings.

2MC
These earnings are fully legitimate. Some may argue that companies like Micron (MU) or Nvidia (NVDA) are at cyclical highs and could come back down a bit, but the earnings they’re pulling in today are real. It’s actual cash flow coming in.
So I don’t have a gripe with that contribution to earnings. Instead, my gripe is that the cost side of it is not being reflected in expenses of S&P 500 companies.
Chip and memory companies are high margin, but revenues are still significantly higher than earnings. Those in the S&P 500 have anticipated 2027 revenues of $1.091T.
2MC
Inclusive of TSMC and SK Hynix, chip and memory revenues are expected to reach $1.71T in 2027.
The customers buying from these chip and memory companies are overwhelmingly constituents of the S&P 500. Thus, a significant portion of the $1.7T is an expense line for the S&P 500.
Or rather, it should be.
Depreciation schedules are preventing that cost from showing up in real time.
S&P company expenses on Chips and Memory
Most S&P companies don’t directly break down the portion of their expenses coming from chips and memory. They are bucketed into line items like capex. So we cannot get an exact figure. Instead, we will attempt to calculate it from the sales of chips and semi-companies to S&P companies.
Let us begin by estimating the portion of chip and memory revenues that come from S&P 500 customers.
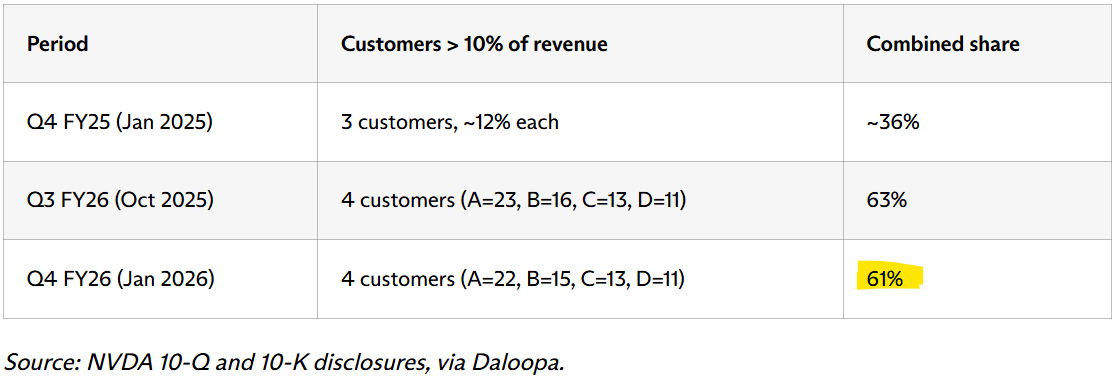
NVDA’s 10-K reveals that 61% of its sales are to customers A, B, C, and D.
NVDA and Daloopa
While listed anonymously, customers A, B, C, and D are thought to be some combination of Microsoft (MSFT), Meta (META), Amazon (AMZN), and Google (GOOG) (GOOGL).
These are all S&P 500 companies.
Therefore, at least 61% (probably substantially higher) of NVDA’s revenues are an expense item for the S&P.
If we apply this same 61% figure across the industry, that’s total sales to S&P 500 companies of $1.04T.

2MC
The 61% figure as a percentage of sales to S&P companies is low for NVDA but might be slightly high for overseas players like SK Hynix. Overall, I think it’s in the right ballpark but clearly with significant error bars in both directions.
Using this figure, we can estimate the distortion caused by accounting elections.
Depreciation Schedule Distorting Earnings
- Earnings of $577.7B attributable to S&P 500 companies in 2027 are forecast to come from chip and memory companies.
- Expenses related to chips and memory of S&P 500 companies in 2027 are approximately $1.04T.
Here’s the imbalance: The entirety of those estimated earnings are being counted toward S&P 500 2027 earnings, while only a fraction of the expense is being recorded in 2027.
The fraction of expense is unusually low because depreciation schedules of the hyperscalers have been lengthened.
- In 2023 Alphabet lengthened its depreciation schedule from 4-5 years to six years. The new longer figure shows up in the fiscal 2024 10-K.
“We depreciate servers and network equipment generally over a period of six years.”
- In 2025, Meta extended depreciation schedules from 4-5 years to 5.5 years as per the 10-K.
“In January 2025, we completed an assessment of the useful lives of property and equipment, which resulted in an increase in the estimated useful lives of most servers and network assets to 5.5 years.”
This means that these companies are only expensing about 18% of their chip and memory expense in the year in which they buy it.
- ~$1.04T will be spent on chips and memory in 2027.
- ~$190B of that $1.04T will be expensed in 2027.
The rest stays on their balance sheets as a depreciable asset.
This creates an $854B gap between the cash S&P 500 companies are paying versus what is actually showing up as expenses.

2MC
Depreciation expense schedules do catch up over time, as this expense item will be recurring for the next 5.5 to 6 years, but because of how rapidly capex has accelerated, the cumulative depreciation is far behind the cash outlay.
As a result, AI-related expenses are being drastically understated on income statements in 2026 and 2027.
What does this mean for overall earnings and valuation?
Applying the numbers to valuation
If the S&P 500 companies were to treat the entire $1.04T cash spent on chips and memory as a true expense rather than depreciating it over freshly lengthened depreciation schedules, S&P 500 earnings would be lower by about $854 billion.
That’s fully 24% of the $3.5T S&P companies are forecast to earn in 2027.
Multiples already look high for the index, and earnings are being overstated by $854B. If one considers cash expense to be a real expense, the forward multiple of the S&P 500 would be 24.8X
The forecast forward multiple of 18.8X for the S&P 500 is already quite high by historical standards. 24.8X adjusted multiples are astronomically high and, in my opinion, bubble territory.
The bottom line
Over time, as there have been more years of exceedingly high capex, depreciation will start to catch up. As it does, it will take a huge bite out of earnings growth.
The net effect of the timing of expense recognition in these depreciation schedules is that it has pulled forward future earnings. In 2028, 2029, and 2030, these companies will still be expensing their 2026 and 2027 capex.
As the full expense starts to be recognized, earnings will look far weaker than the market is pricing in.