


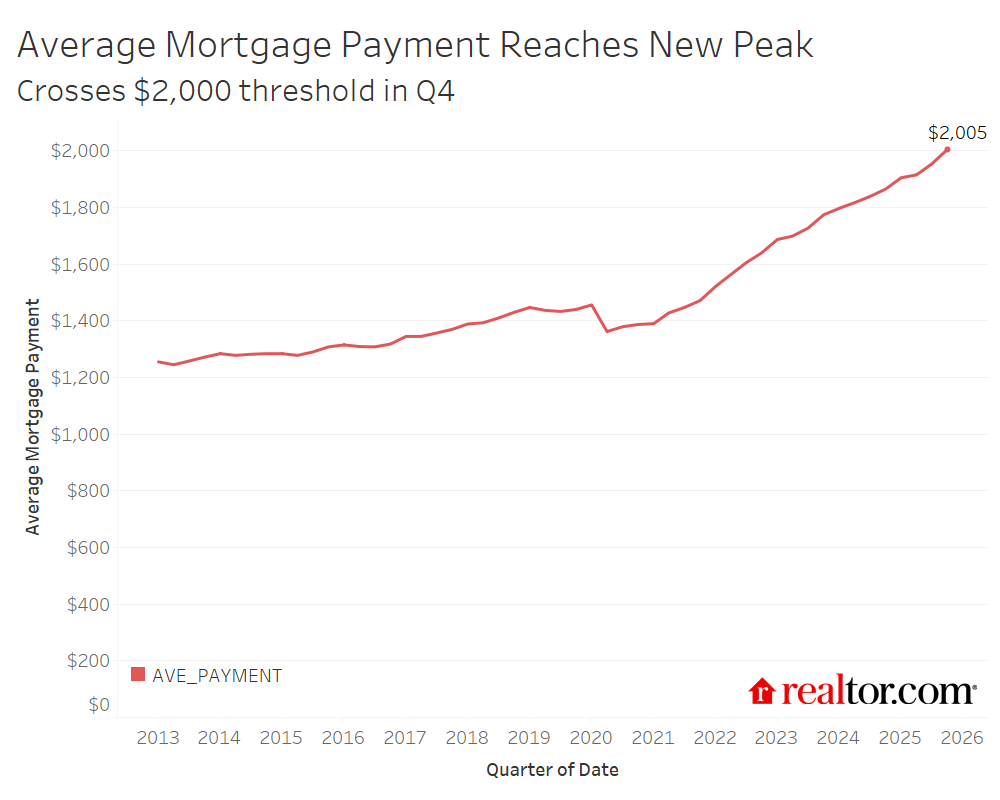
For the first time, the typical mortgage holder’s monthly payment topped $2,000 in Q4 2025. New homebuyers crossed that threshold in September 2022, reflecting how recently attained mortgages carry the full weight of today’s higher prices and rates. Mortgage rates dropped through the fourth quarter of 2025, starting at 6.34% in early October and finishing the year at 6.15%. They continued to fall through February 2026 and then rose sharply in March due to concerns over the conflict in the Middle East. Except for one week in late February 2026, rates have remained above 6% since September 2022, keeping many would-be sellers “locked in” and hindering total inventory recovery.
Despite those headwinds, March 2026 housing data showed a bit of energy going into spring: Pending sales were up 3.9% year over year, the third consecutive month of annual gains, and new listings jumped 21.2% from February. Active listings rose 8.1% year over year as well, a meaningful improvement but still 13.8% below typical 2017–19 pre-pandemic levels. New-construction inventory has continued to fill some of the gap, with the new-home share of inventory remaining above pre-pandemic levels. Scarce resale inventory has kept upward pressure on home prices in supply-constrained markets, especially affordable areas where homes continue to sell quickly and buyers face competition.
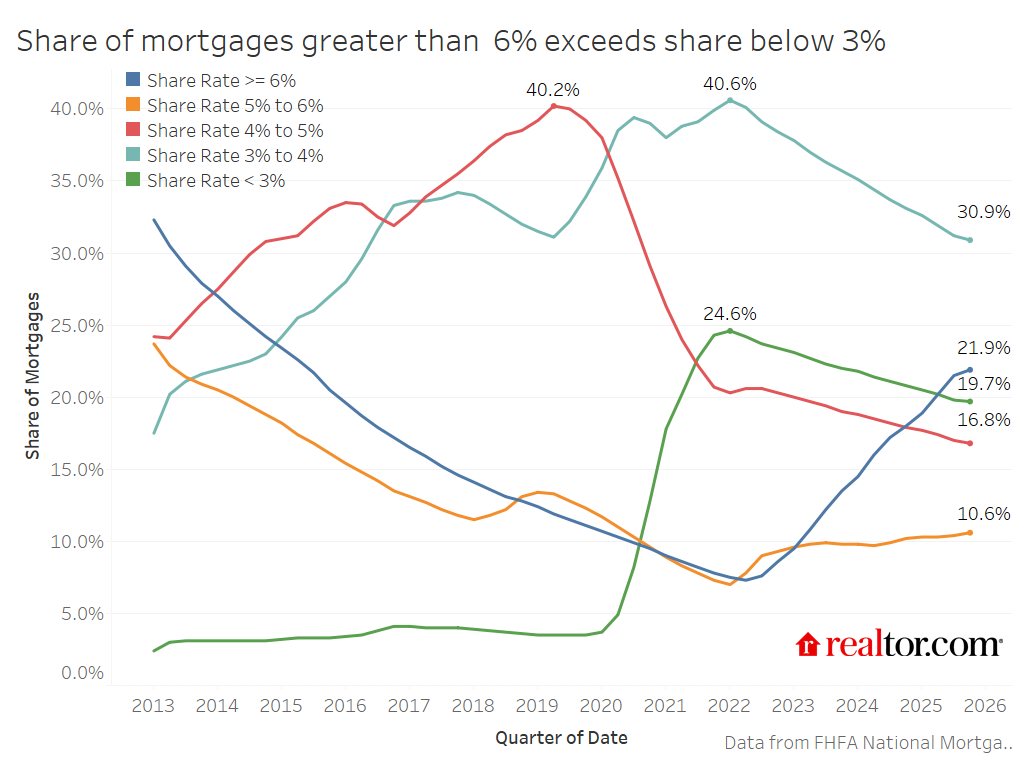
In the fourth quarter of 2025, 19.7% of outstanding mortgages had an interest rate below 3%, down from 19.8% in Q3 and a peak of roughly 24.6% in early 2022. The Freddie Mac fixed rate on a 30-year loan dipped below 3% in July 2020, and generally stayed below that threshold through September 2021. Highlighting how extraordinary these conditions were, this was the only period in the data’s history (since 1971) when rates dropped below this threshold.
Between the third and fourth quarters of 2025, the shifts in rate share were modest but consistent in direction: Every bracket below 4% continued to shrink, while the 5%-to-6% and 6%-or-higher brackets both grew. The sub-4% share declined by a combined 0.4 percentage points, easing slowly as 38% of outstanding mortgages, the highest share in the data’s history, sit in the 5-to-7-year loan age window, meaning loans originated between 2018 and 2020. The early-COVID-19 refi cohort has aged squarely into that 5-to-7-year range, exceeding the 1-to-4-year cohort share in Q4. These are borrowers who locked in low COVID-19-era rates and are not yet at a natural payoff or move horizon. The very gradual erosion is a sign of just how durable the lock-in is. The slow shift captures both “swappers,” or borrowers exchanging a lower-rate mortgage for a higher-rate one, as well as buyers paying off their mortgages and owning outright.
At the same time, builders continue to offer rate buydowns and other incentives, which may be helping to sustain the 4%-to-6% range and keep those shares relatively stable. The 5%-to-6% bracket edged up 0.2 percentage points to 10.6%, consistent with some buyers locking in on the softer end of the prevailing rate environment.
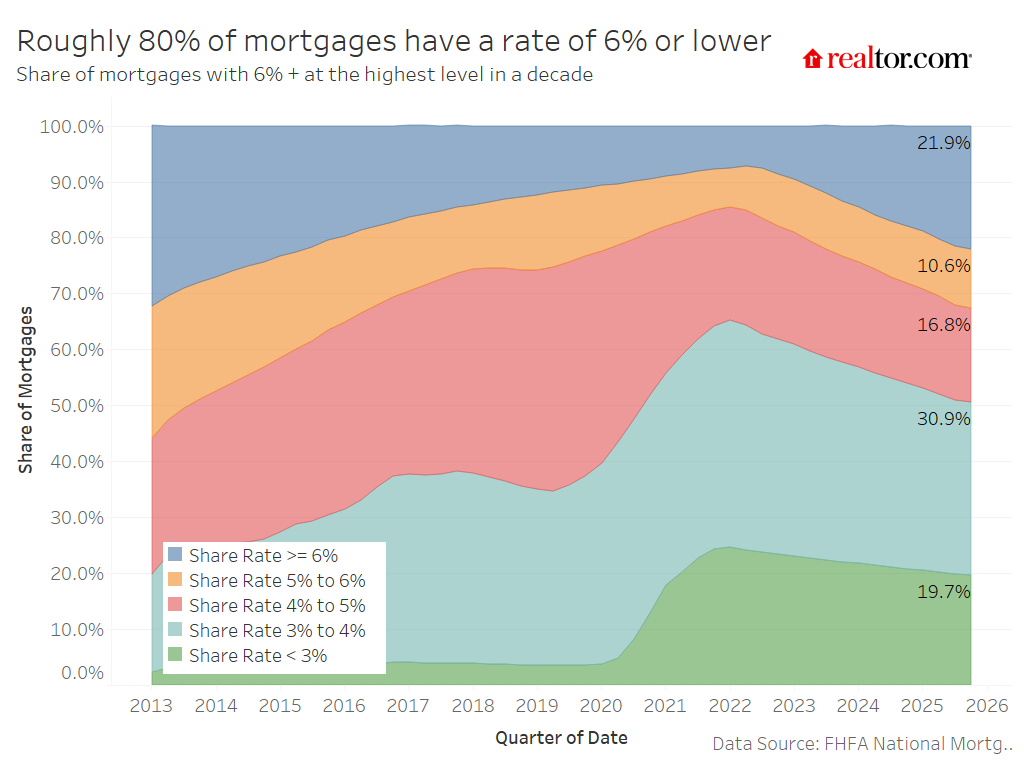
| Outstanding Mortgage Rate | Share of Mortgages (2025 Q4) | Cumulative Share |
| < 3% | 19.7% | 19.7% |
| 3% to 4% | 30.9% | 50.6% |
| 4% to 5% | 16.8% | 67.4% |
| 5% to 6% | 10.6% | 78.0% |
| 6% + | 21.9% | 100% |
Source: FHFA National Mortgage Database
Altogether, just over half of outstanding mortgages (50.6%) still carry rates of 4% or lower, and roughly 78% have a rate below 6%. The 6%-or-higher share now stands at 21.9%, up 3.9 percentage points from Q4 2024’s 18.0%, a meaningful year-over-year acceleration driven by sustained buyer activity despite elevated borrowing costs.
The share of homeowners holding a mortgage with a rate of 6% or higher increased nearly 4 percentage points between Q4 2024 and Q4 2025, as buyer activity carried on despite high rates. Even in today’s high-price, high-rate market, homebuying activity around major life events, such as having kids, a job change, or a divorce, keeps the market in motion. Easing inflation and mortgage rates will be key drivers of seller activity as well, which will relieve some of the price pressure and competition in today’s undersupplied market.
Outstanding mortgage payment crosses $2,000 for the first time
The $2,005 average payment is a floor on affordability pressure, not a ceiling, as it reflects the full portfolio, including the large cohort of pre-2022 borrowers still carrying sub-4% rates. New borrowers entering the market today face substantially higher payments than the existing portfolio average implies, which is keeping many potential sellers locked in place. The average payment stood at $1,255 in early 2013, climbed gradually to $1,456 by the start of 2020, and then accelerated sharply as home prices surged and new originations came in at higher loan balances. The biggest leg up came after mid-2022, when the rate spike compounded already elevated prices. The average payment rose more than $600 in just three years, from $1,390 in early 2021 to $2,005 today, a 44% increase in roughly four years.
The COVID-19 refi cohort is aging—and reshaping the tenure distribution
One of the most striking structural shifts visible in the Q4 2025 data is a dramatic reshuffling of the portfolio’s loan tenure distribution. The share of outstanding mortgages with a loan age between five and seven years surged from 11.8% in Q4 2023 to 38.4% in Q4 2025, a 26.6 percentage point increase in just two years, and enough to overtake the under-4-year bucket for the first time. This is the mechanical consequence of the 2020–21 refinancing wave, when many homeowners locked in sub-3% and sub-4% rates, now aging into that 5-to-7-year window. Additionally, fewer buyers have refinanced in the past four-plus years, skewing the market away from 1-to-4-year tenure mortgages.
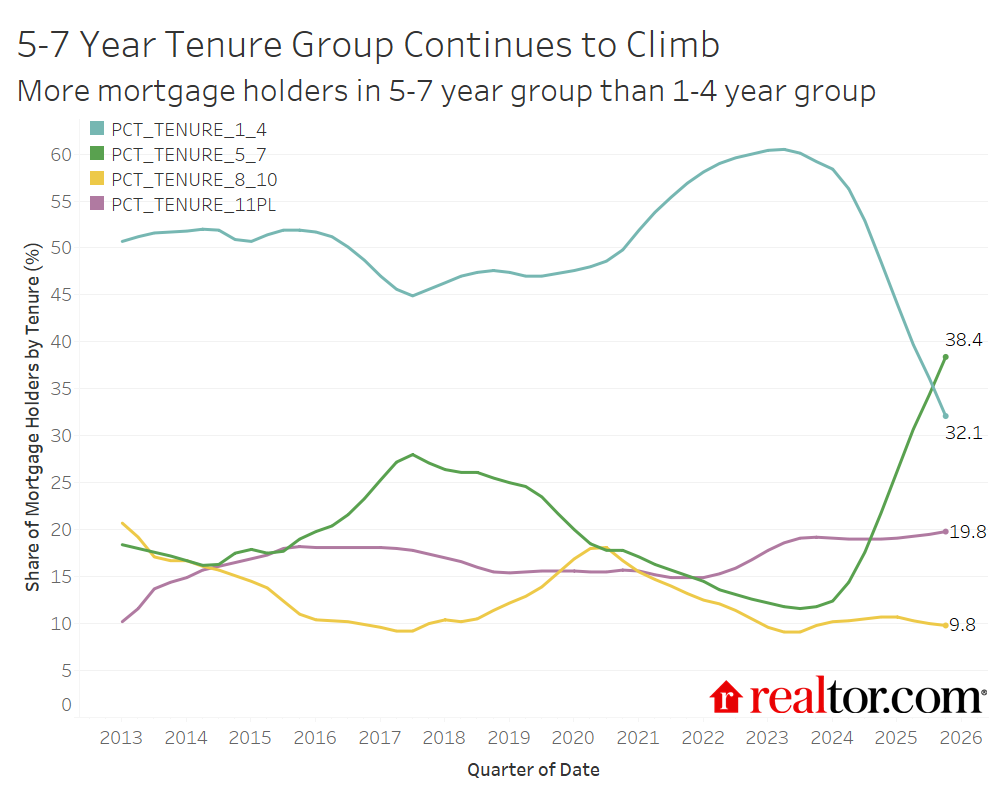
The mirror image of this shift is equally striking: The share of mortgages less than 4 years old collapsed from 59.2% in Q4 2023 to just 32.1% in Q4 2025, as the supply of new originations dried up in a high-rate environment. A market that once turned over rapidly, with nearly 6 in 10 outstanding loans originated in the prior four years, has become increasingly static. Even in the pre-pandemic period, nearly half of all outstanding mortgages had a 1-to-4-year tenure, well above today’s level and consistent with multidecade-low home sales over the past few years.
Together, these dynamics paint a picture of a mortgage market caught in a bottleneck. The COVID-19 cohort is holding steady as their rates are too low and their equity too substantial to motivate a move, and new entrants are trickling in slowly. Until rate relief is sufficient to unlock meaningful seller activity, this tenure distribution will continue to concentrate in the 5-to-7-year range. As that cohort continues to age, moving from the 5-to-7-year window into the 8-to-10-year bucket over the next few years, watch for whether rising equity and life-stage transitions gradually overcome the financial inertia of a sub-4% rate. For now, the data suggests they haven’t.
Looking ahead
While roughly 78% of outstanding mortgages still carry rates below 6%, indicating that the rate lock-in remains substantial, the steady quarterly erosion of the sub-4% cohort and the accelerating growth of the 6%-plus population suggest the market’s center of gravity is gradually shifting. The question for 2026, now complicated by renewed rate volatility tied to geopolitical uncertainty, is whether relief arrives fast enough to unlock reluctant sellers before another spring season slips by.


